As your data catalog grows, how do you know which assets meet your organization’s governance standards? Amazon SageMaker Unified Studio provides the building blocks for governance such as metadata form definitions, data quality scores, glossary associations, subscription data, and a daily catalog export queryable through SQL.
A data catalog typically answers what exists as asset names, schemas, and ownership. SageMaker Unified Studio goes further, surfacing governance signals like metadata completeness, data quality scores, and glossary associations for each asset. This pattern brings them together into a single view you can query across all your assets, projects, and data products.
This post walks through how to build that enrichment pipeline and provide an asset scorecard example with an extensible set of dimensions and weights. However, the key takeaway is the pattern itself: after the signals are in one place, your team can define what “compliant” means for your context and manage assets and data products at scale. The pipeline is the foundation, and the business/compliance logic is yours to adapt and evolve.
The governance questions this pattern can answer include:
- Data Owner: Which of my assets are missing a required metadata form?
- Data Steward: Which assets have no glossary terms associated?
- Data Platform team/Managers: Is compliance improving since the team published the new governance rules, within and between projects?
- Chief Data Officer: Which departments need to work to provide more reliable data products to the organization?
This solution extends Analyzing your data catalog: Query SageMaker Catalog metadata with SQL, which introduced the asset metadata export feature. This post focuses on enriching the metadata export to support an enhanced and data-driven governance compliance strategy.
Solution overview
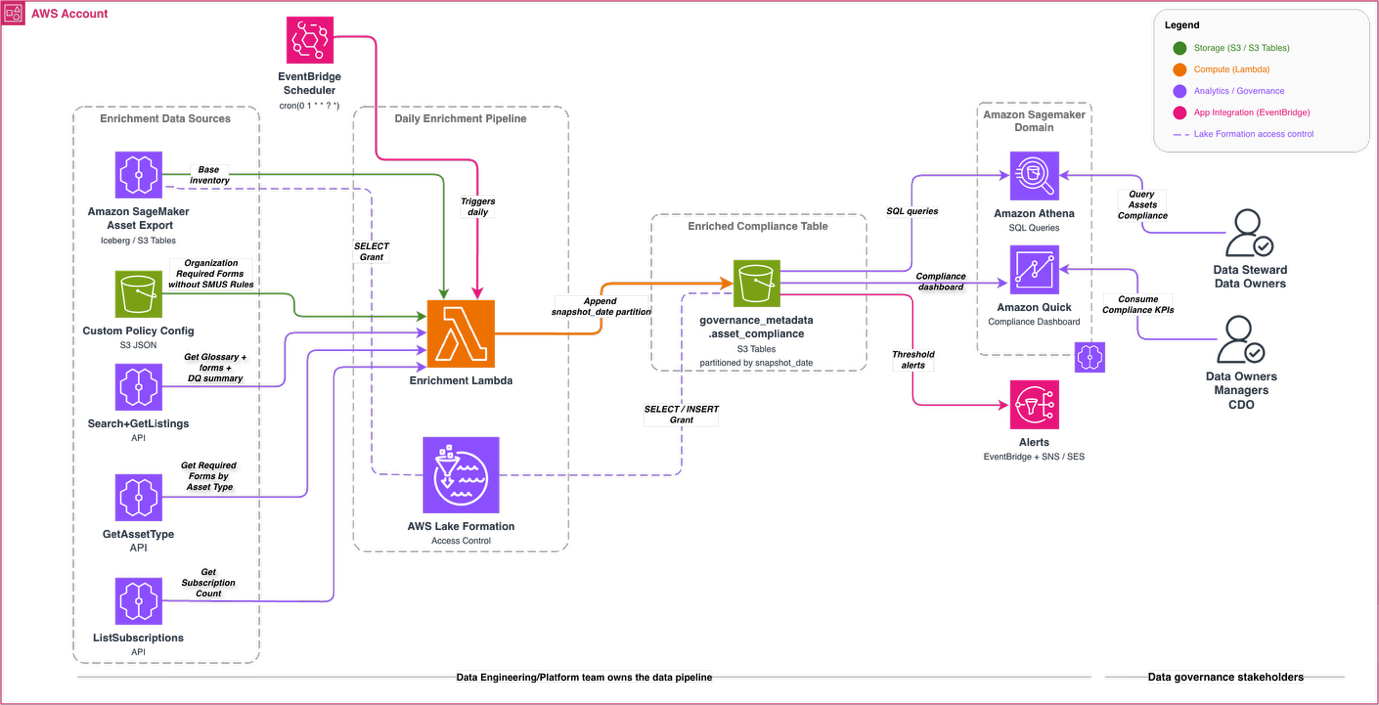
Figure 1: Daily governance enrichment pipeline, from the five data sources through the enrichment Lambda function to the Amazon Athena, AWS Quick Sight, and Amazon EventBridge consumers
The enriched compliance table is itself an Amazon Simple Storage Service (Amazon S3) Table asset in the SageMaker catalog queryable inside SageMaker Unified Studio alongside all domain assets.
The enrichment pipeline runs daily and consists of five data sources joined by an enrichment Lambda function:
- Amazon SageMaker Asset Metadata Export: the base inventory of all published assets, stored as an S3 Table.
- Form Policy Config: an S3 JSON file that defines custom organization-level required forms per project and asset type.
- Search / GetListing API: returns glossary terms, attached metadata forms, and a data quality summary per asset.
- GetAssetType API: returns the complete data quality rules count per asset.
- ListSubscriptions API: returns the number of active consumer subscriptions per published asset.
The pipeline reads from all five sources, computes a weighted compliance score per asset, and writes the result as a new daily snapshot partition to the governance_metadata.asset_compliance S3 Table. Downstream consumers such as Amazon Athena, AWS Quick Sight compliance dashboard, and Amazon EventBridge compliance alerts, read from that enriched table.
The following figure shows the end data product you will build: a compliance dashboard scoring every asset across your projects.
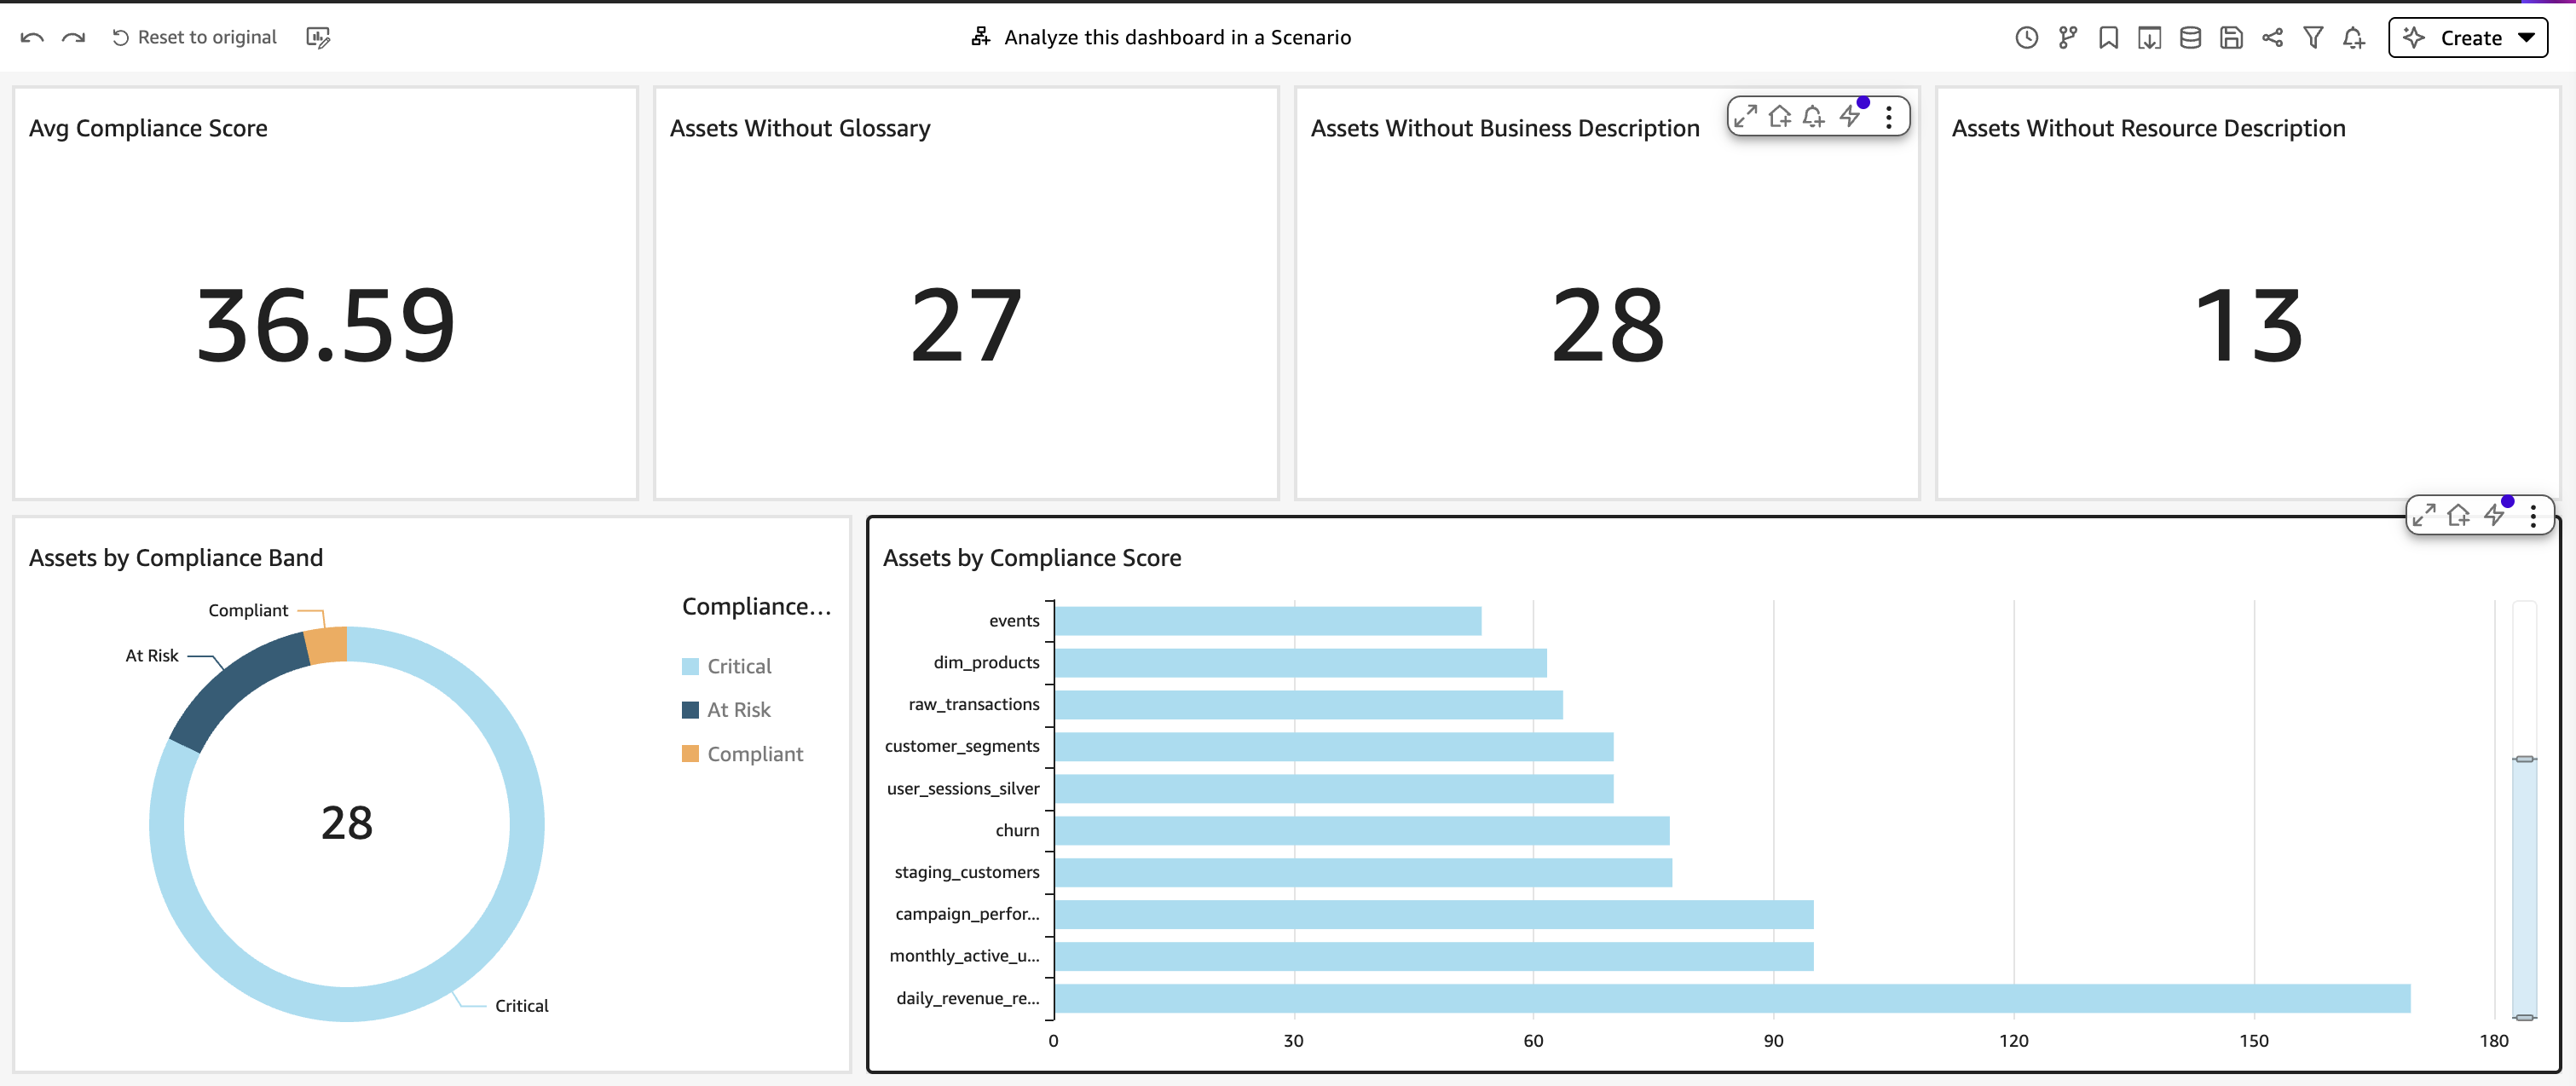
Figure 2: Compliance dashboard scoring every asset across your projects, the end product you build
Prerequisites
Before you begin, verify that you have the following in place:
- Python 3.12 and AWS Cloud Development Kit (AWS CDK) for deployment of the enrichment pipeline from the sample GitHub repository.
- An Amazon SageMaker Unified Studio domain. This post demonstrates the solution using an AWS IAM Identity Center (IDC)-based domain. You need permission to enable the asset metadata export on the domain (activating the export is covered in Part 1).
- Published assets in the SageMaker Unified Studio domain: the solution enriches information based on assets already published in the domain.
- An AWS account with permissions to work with the services used in this solution: AWS Lambda, Amazon Athena, Amazon S3 including Amazon S3 Tables, AWS Glue Data Catalog, AWS Lake Formation, AWS Quick Sight, and Amazon EventBridge.
- AWS Lake Formation access: The asset metadata export and the enriched table are governed by AWS Lake Formation, so you need to grant the Lambda execution role and the Amazon service role the appropriate DESCRIBE/SELECT permissions (detailed in the aws-samples repository).
- The AWS Command Line Interface (AWS CLI): configured for your account and target AWS Region.
- An AWS Quick Sight account in the same Region, required for the dashboard in Part 6.
Estimated time to complete is approximately 2 hours. Estimated cost is less than $5 per month for a small test domain (AWS Lambda invocations, Athena queries, and S3 storage). Costs scale with the number of assets and query volume.
Deploy the solution
The complete source code for this solution is available in the sample-smus-asset-scorecard repository on GitHub. The AWS Cloud Development Kit (AWS CDK) stack provisions all required infrastructure, including the enrichment Lambda function, Amazon S3 policy configuration bucket, Amazon EventBridge Scheduler rule, AWS Identity and Access Management (IAM) roles, and the S3 Table namespace. Follow the walkthrough available in the repository to deploy the solution.
Part 1: The asset metadata export
The asset metadata export serves as the primary data source for the enriched scorecard dataset. To activate the export once per domain, use the following AWS CLI command:
Within 24 hours you can read the asset metadata export as an S3 Table in SageMaker Unified Studio query editor (table asset_metadata.asset). You can check the Exporting Asset Metadata official documentation to get more details about the Asset Metadata export. Three fields from the export are used by the enrichment pipeline:
- asset_id: the identity of each asset in the catalog, and the join key the enrichment uses to map each row to its published listing (Part 3).
- extended_metadata[‘owningEntityId’]: this single key from the metadata map identifies which project owns the asset, driving the per-project compliance policy lookup in Part 2.
- business_description and resource_description: the documentation signals that contribute to the description dimension of the compliance score.
The following figure shows an example of the Asset Metadata Export:
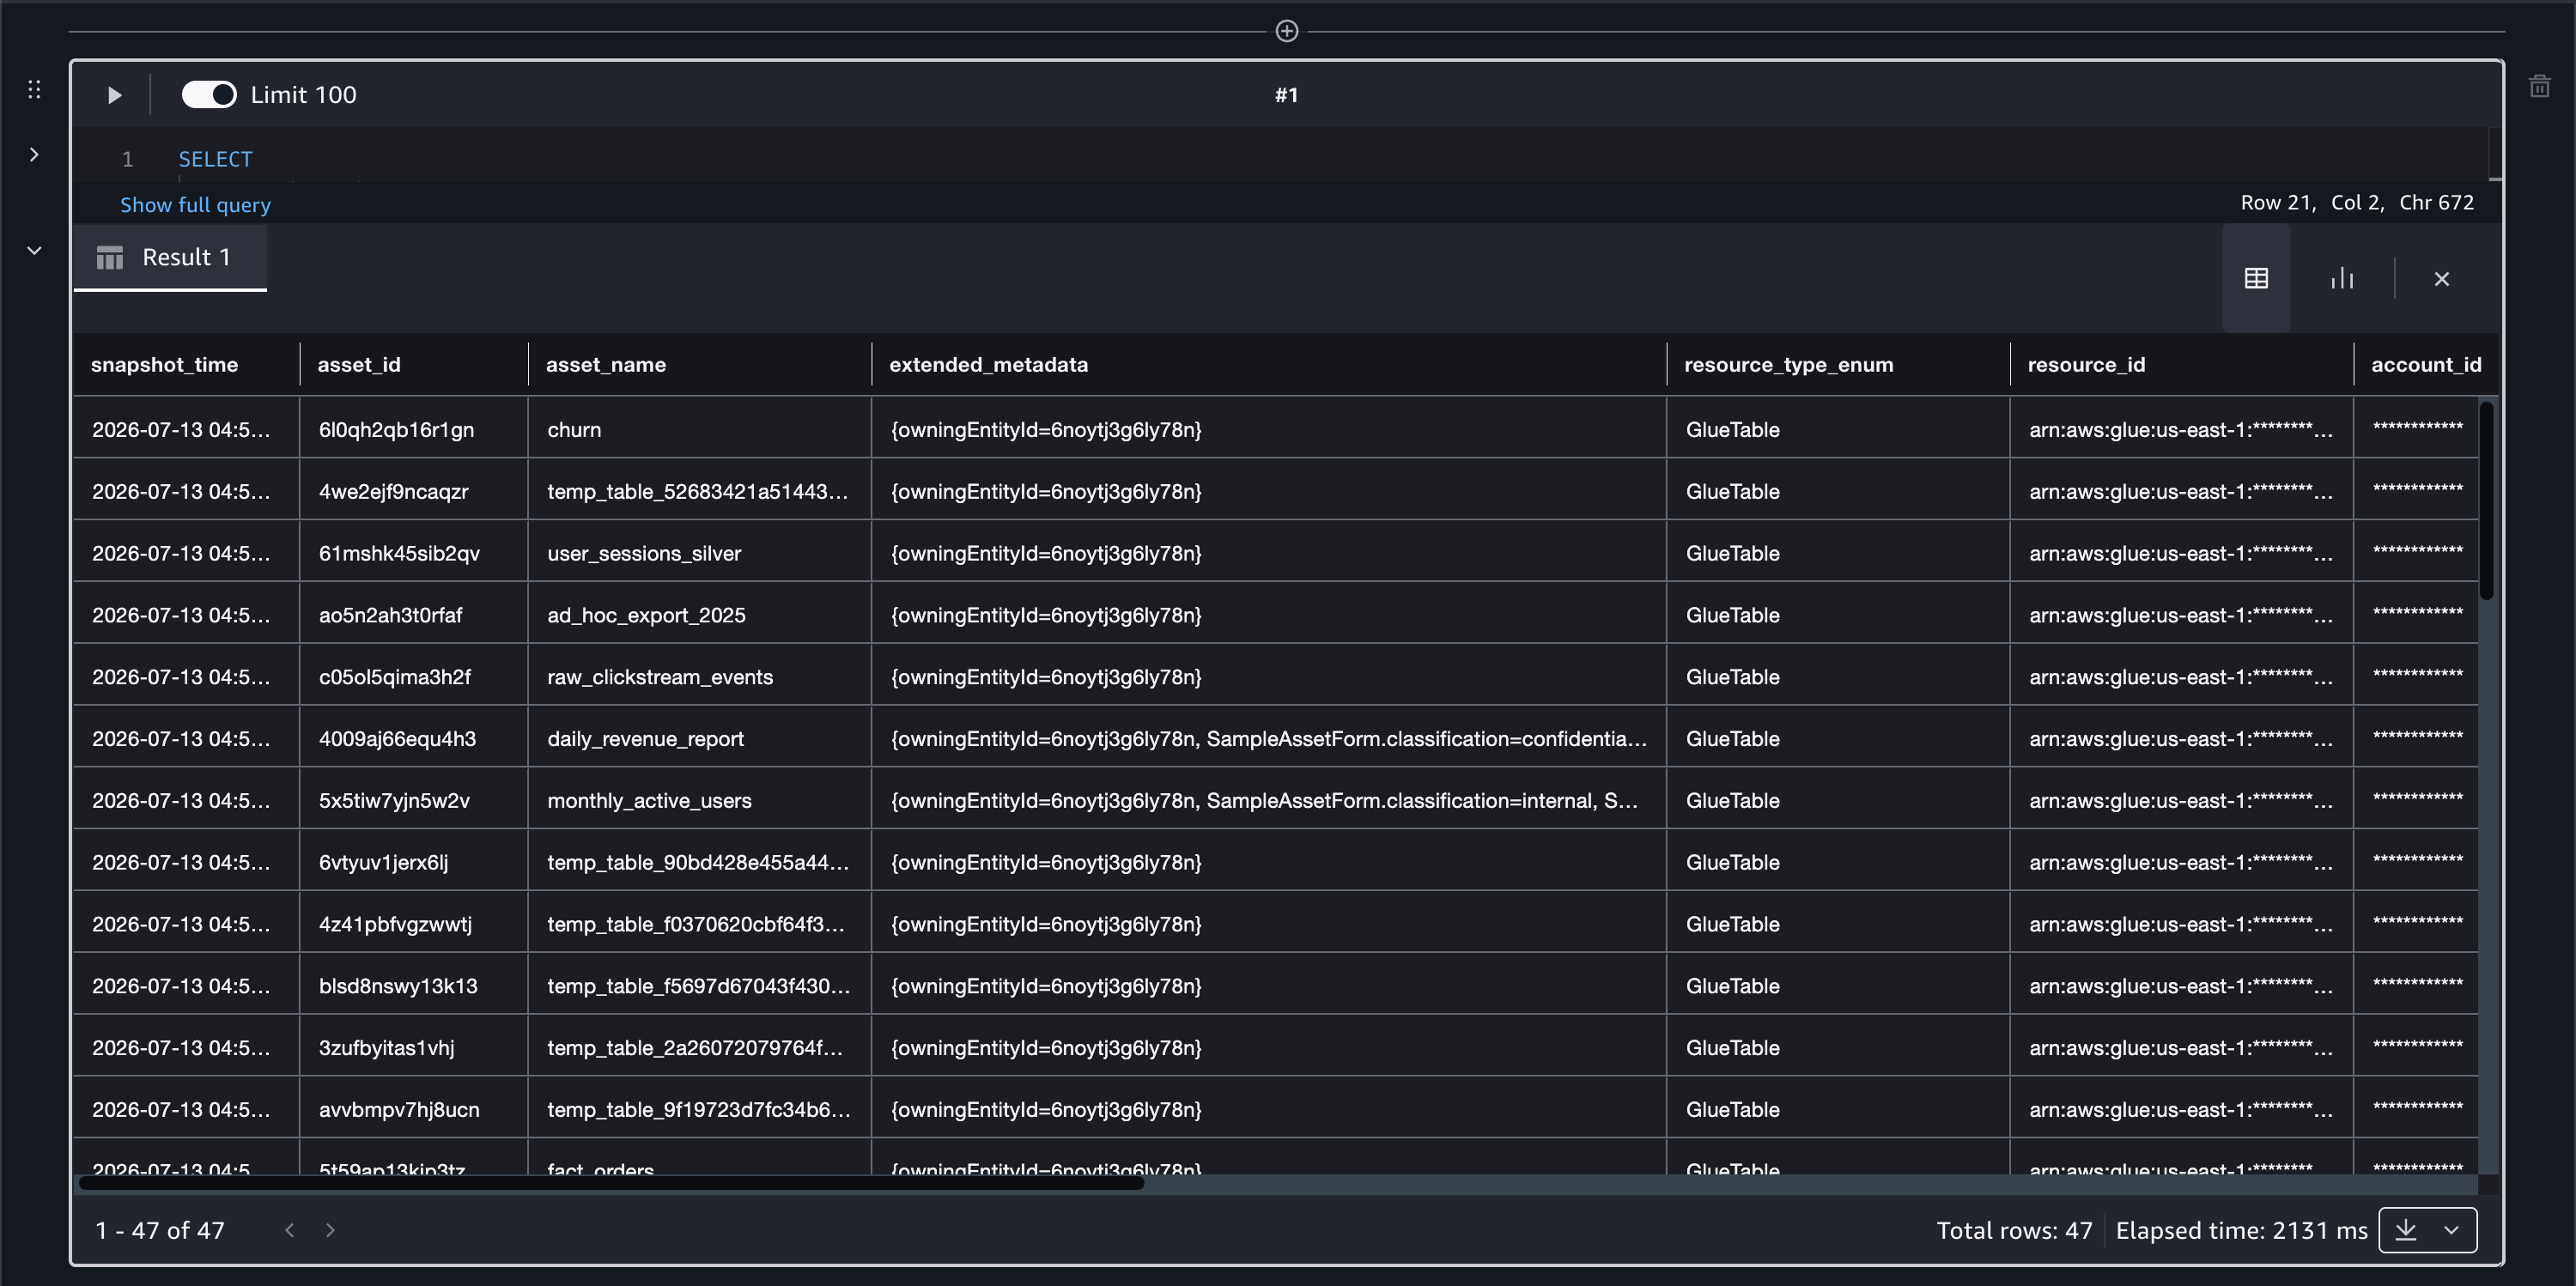
Figure 3: Example of the asset metadata export queried in the SageMaker query editor
Part 2: The policy layer: Defining mandatory metadata forms
The export tells you what metadata form fields are filled. But required is a two-level concept in this solution:
Level 1: Amazon SageMaker Unified Studio metadata enforcement rules. You can configure mandatory metadata forms for publishing and subscription flows. These enforcement rules are defined at the asset-type level. You can call the GetAssetType API and inspect the required boolean in formsOutput.
Level 2: Custom organization-defined requirements. This solution also accounts for required metadata forms that lack enforcement rules, but your organization still considers mandatory. For example, a project might require a DataClassificationForm on every Glue table, even though SageMaker Unified Studio itself doesn’t enforce it at the asset-type level. These project-specific rules don’t exist as a native API endpoint, they can be stored externally in an S3 configuration file.
The enrichment pipeline reads both layers and takes their union. The SageMaker Unified Studio enforcement rules come from GetAssetType API per asset type and the custom organization-specific overrides come from a policy file stored in Amazon S3. Change the following sample file with the project IDs and required forms for your use case and put it in the S3 bucket created with CDK (see the Walkthrough section in the Readme of sample repository):
The S3 configuration file is updated whenever your governance policy evolves. The GetAssetType call ensures the pipeline always respects whatever enforcement rules are defined in SageMaker Unified Studio, including any new rules created in future revisions.
Part 3: The enrichment pipeline
The enrichment pipeline reads the latest export snapshot and joins it with governance facets from the published catalog through GetListing. It then merges the compliance policy from both enforcement rules (GetAssetType) and the custom organization-defined policy file. The complete implementation with annotated code is available in the aws-samples repository.
The enrichment Lambda reads the latest asset metadata export, calls the APIs for the dimensions not present in the export (data quality scores and glossary associations), and writes one enriched compliance record per asset.
3.1 The compliance score
The compliance score combines five independent dimensions, each contributing a weighted percentage as the following table shows:
| Dimension | Weight | Signal |
| Form coverage | 50% | % of required forms present compared to policy |
| Data quality score | 20% | Data quality pass/fail percentage |
| Data quality rule coverage | 10% | Actual rules compared to minimum expected |
| Glossary presence | 10% | Has at least 1 glossary term |
| Description | 10% | Has a business or resource description |
Weights and the minimum data quality rules threshold are configurable. Adjust them to reflect your organization’s governance priorities.
3.2 Run the enrichment pipeline
To run the pipeline, invoke the Lambda function as shown in the following example:
Part 4: The governance answers
With the enriched table available, the governance questions listed at the beginning of the post can be answered using SQL queries against the enriched table.
4.1 Assets missing required forms
The following query returns the list of assets missing required forms:
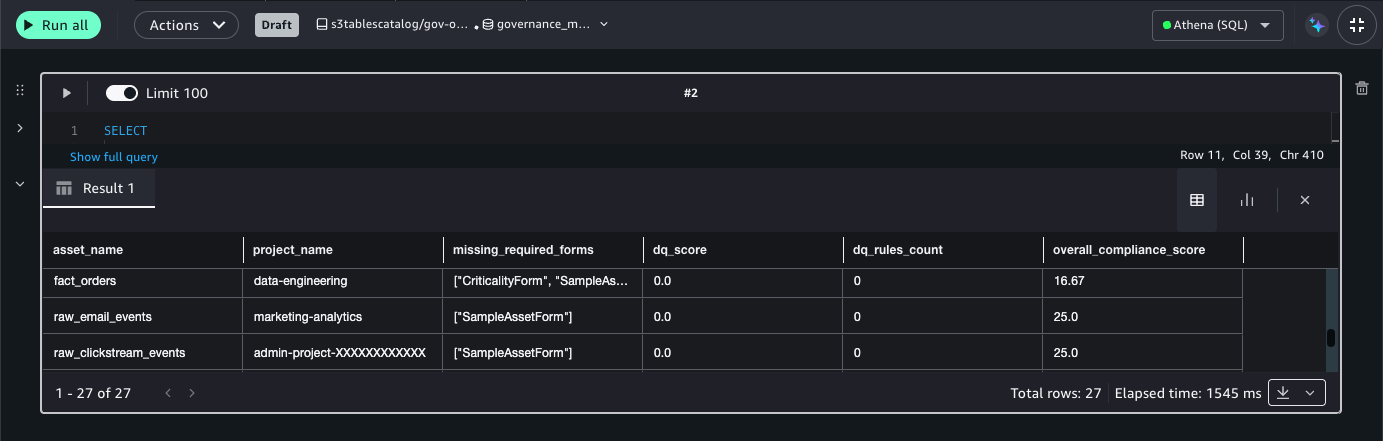
Figure 4: Query result listing the assets that are missing required metadata forms
4.2 Compliance scorecard per project
To explore the scorecard grouped by project, run the following query:
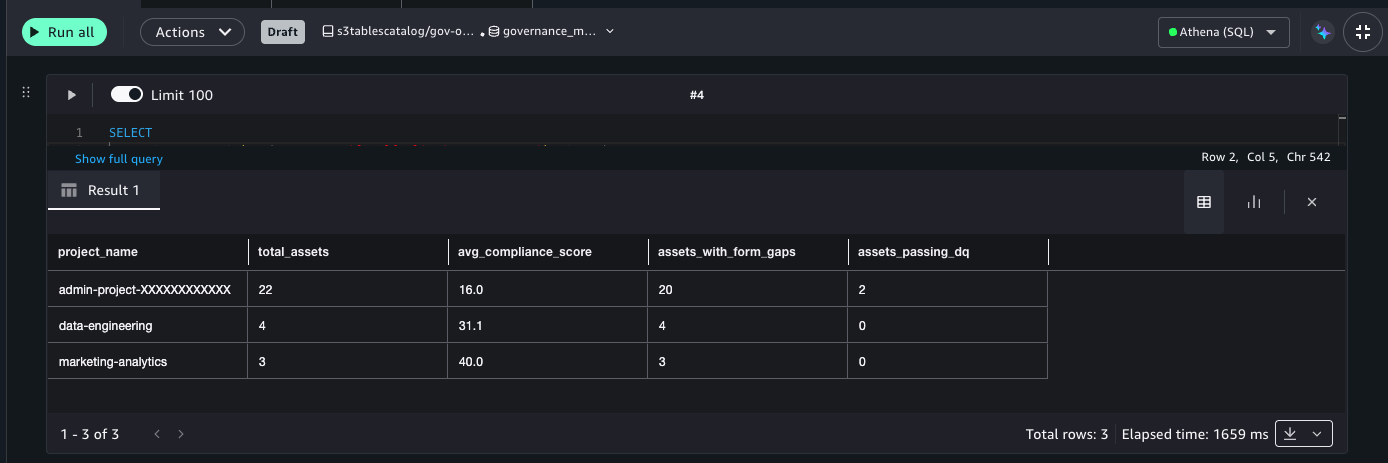
Figure 5: Per-project compliance scorecard aggregation
4.3 Compliance trend since rule publication
To answer how your assets are evolving since you published new rules you can run the following query:
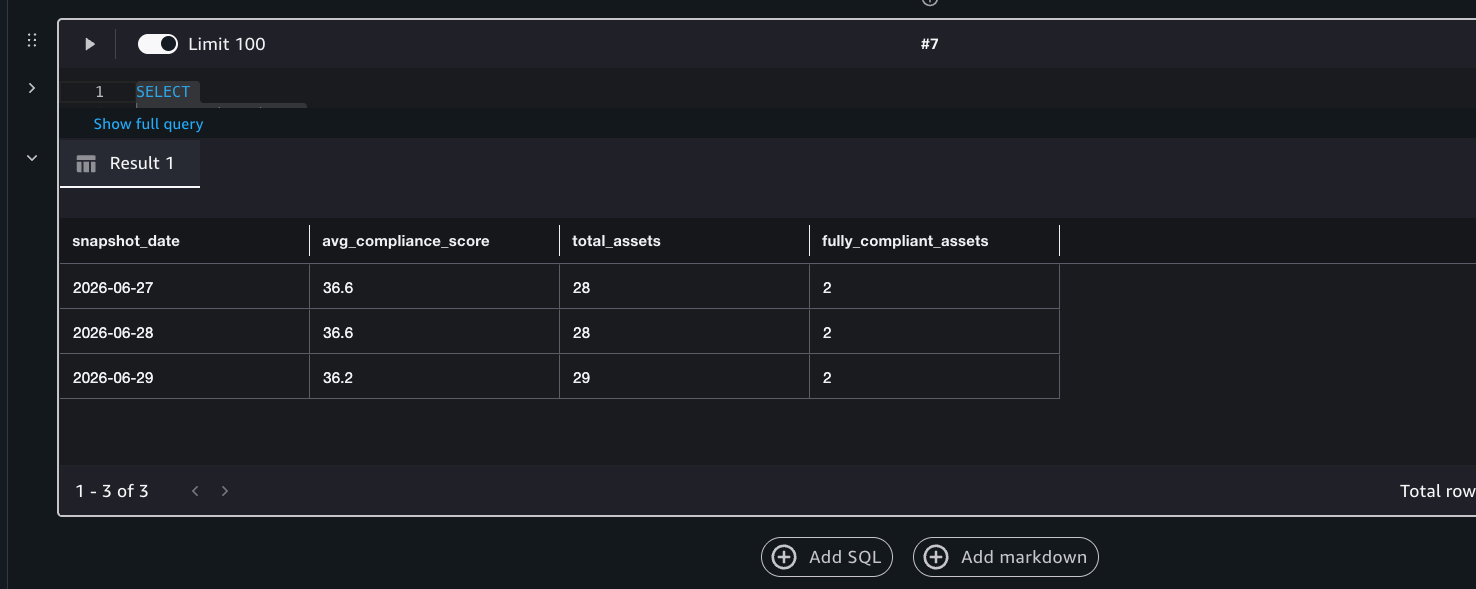
Figure 6: Compliance trend across daily snapshots since the governance policy was published
Part 5: Alerting on non-compliant assets
You can go further and use Amazon EventBridge Scheduler combined with AWS Lambda to send weekly reports and alert your team when compliance drops below a defined threshold:
You can configure the Amazon EventBridge Scheduler rule to fire on a weekly schedule or daily if your organization requires tighter compliance monitoring. The send_governance_alert function is illustrative and can be routed to any channel your team prefers: Amazon Simple Notification Service (Amazon SNS) topics, Amazon Simple Email Service (Amazon SES), or a Slack webhook through an HTTP call.
Part 6: Building a governance dashboard with AWS Quick Sight
With the enriched governance table producing daily compliance scores, the final step is making these insights visible to stakeholders through an actionable and interactive dashboard. AWS Quick Sight connects directly to Amazon Athena, so you can visualize the compliance table directly.
6.1 Connecting and configuring AWS Quick Sight with the enriched table
Grant the AWS Quick Sight service role (aws-quicksight-service-role-v0) Lake Formation DESCRIBE and SELECT permissions on governance_metadata.asset_compliance. You can see details of grants needed in the aws-samples repository. In the repository you also can see a Python script which creates AWS Quick Sight data source, datasets and a complete dashboard with the compliance data, as the following figure shows:
Figure 7: Compliance dashboard connected to the enriched table in AWS Quick Sight
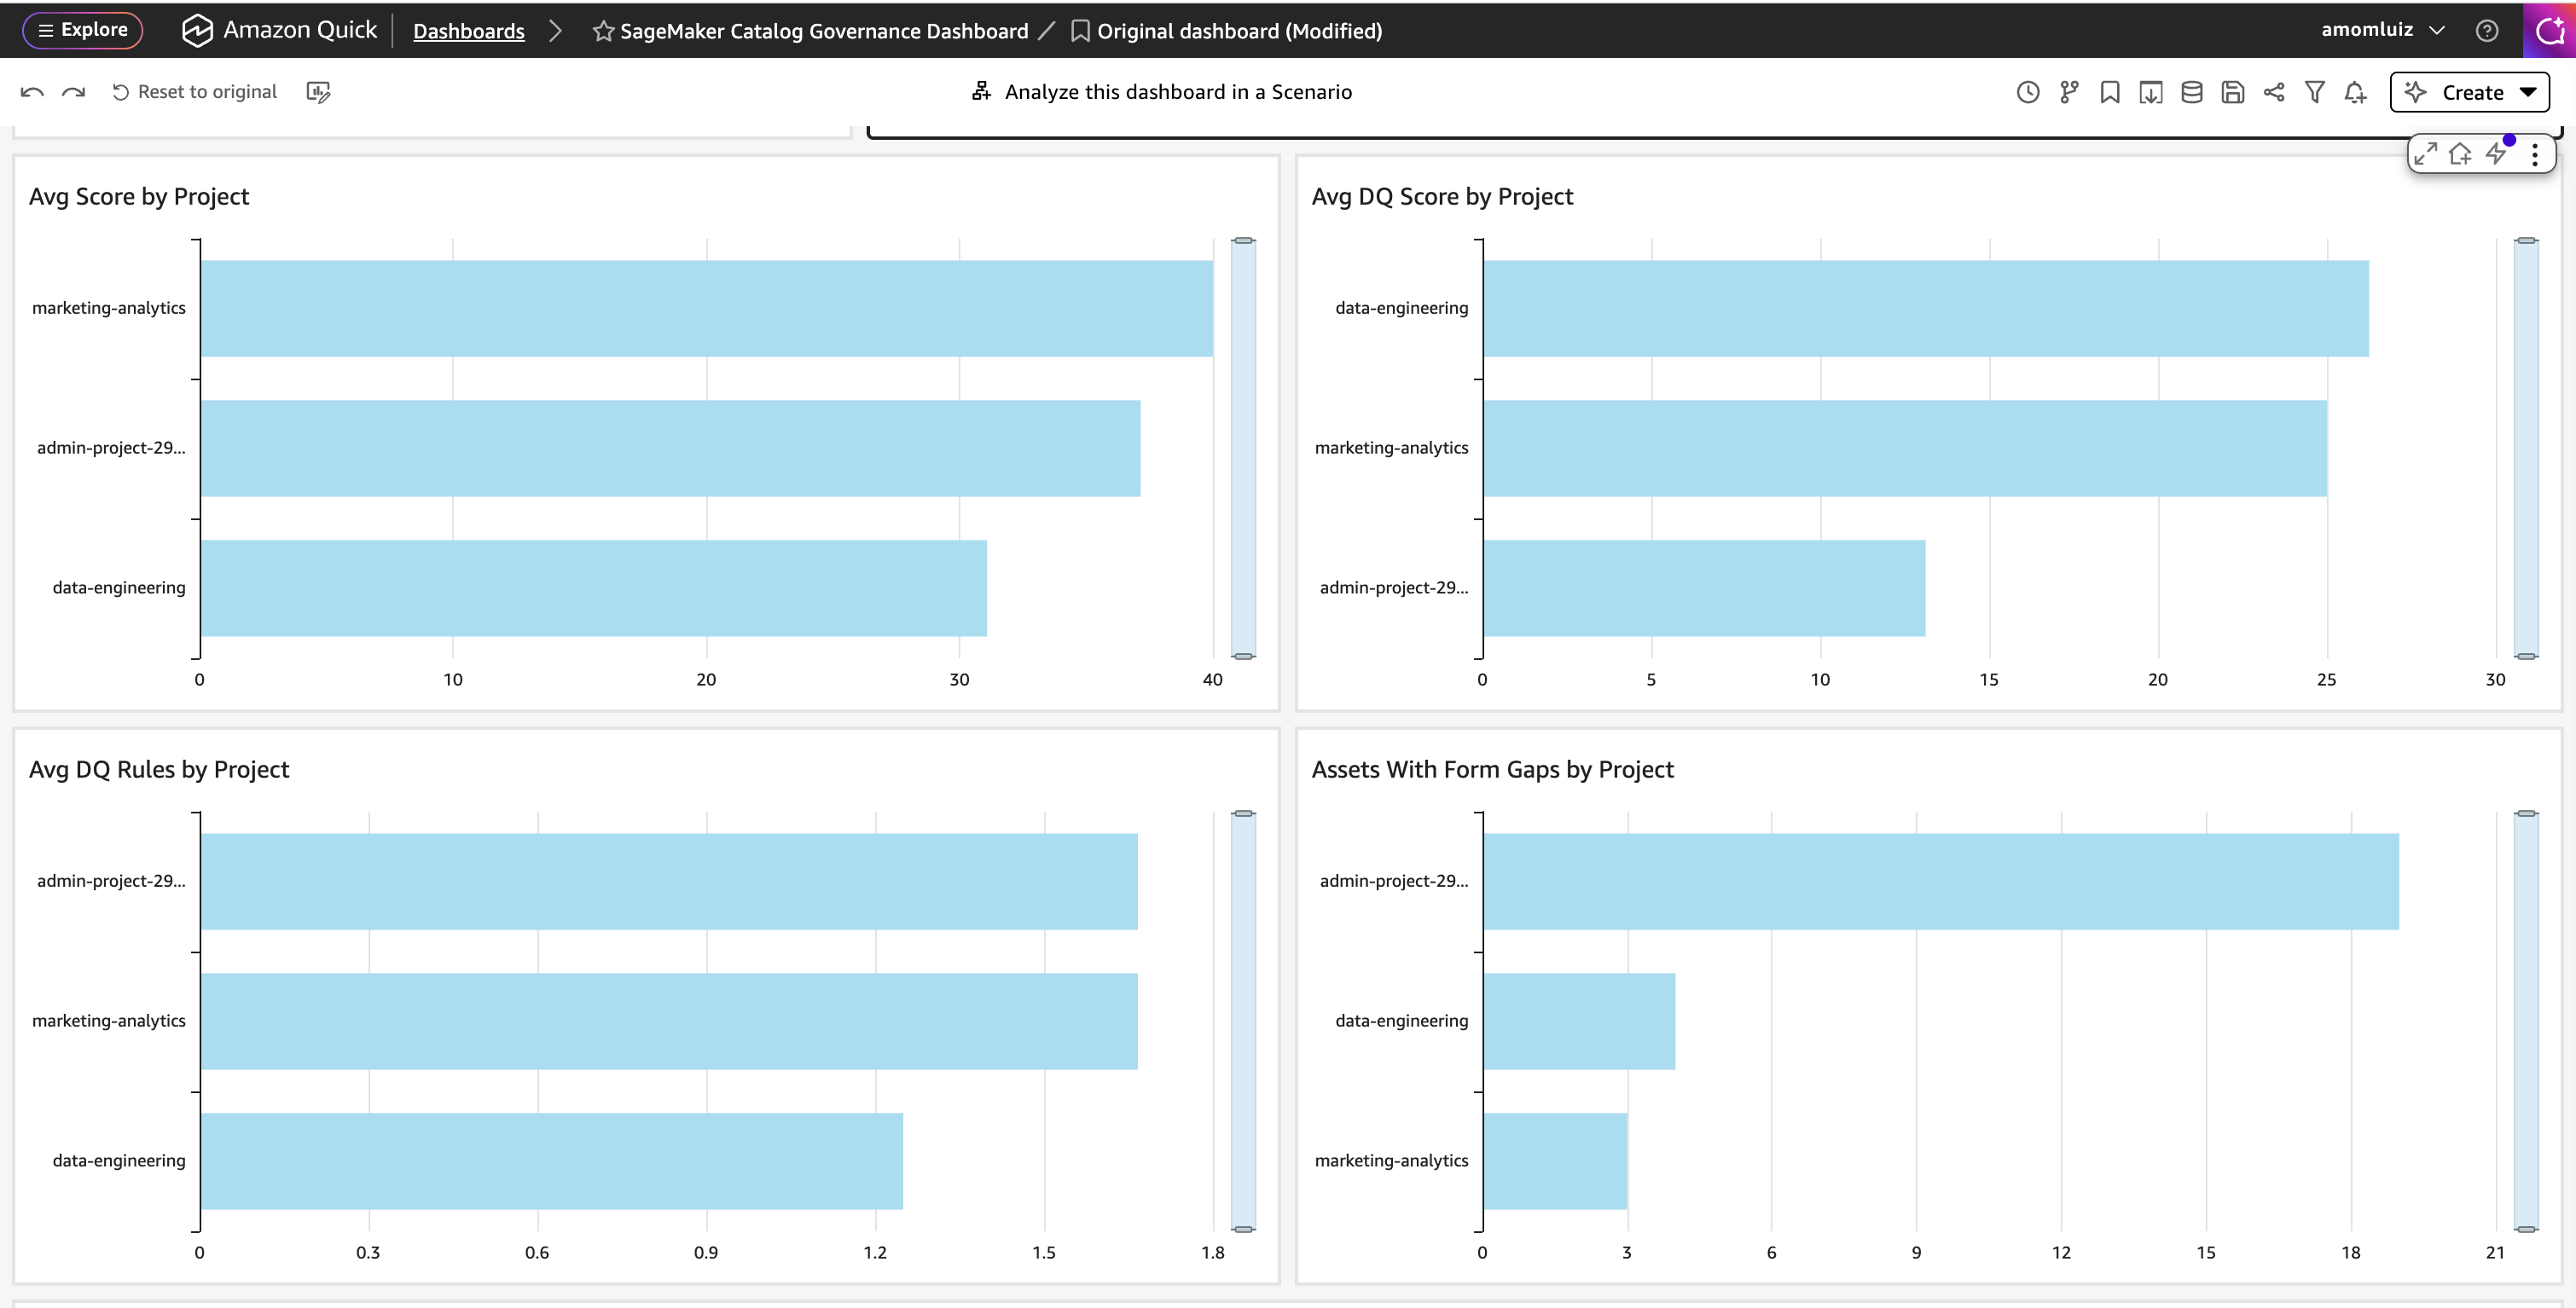
Figure 8: Per-project comparison charts in the governance dashboard
6.2 Create visualization using natural language
Use the natural language Build feature in AWS Quick Sight to create each visualization with a plain-language prompt:
| Visualization | Natural language prompt | Purpose |
| Compliance scorecard | “Show average overall_compliance_score by project_name as a bar chart” | Per-project accountability |
| Compliance band distribution | “Show count of asset_name by compliance_band as a pie chart” | Executive summary |
| Score trend over time | “Show average overall_compliance_score by snapshot_date as a line chart” | Is governance improving? |
| Form gap breakdown | “Show count of asset_name where missing_required_forms is not empty by project_name as a stacked bar” | Which teams have metadata form gaps? |
| Glossary coverage | “Show count of asset_name where glossary_terms_count equals 0 as a KPI” | How many assets have no terms? |
| Data Quality coverage | “Show average dq_rules_count by project_name as a bar chart” | Which projects lack data quality rules? |
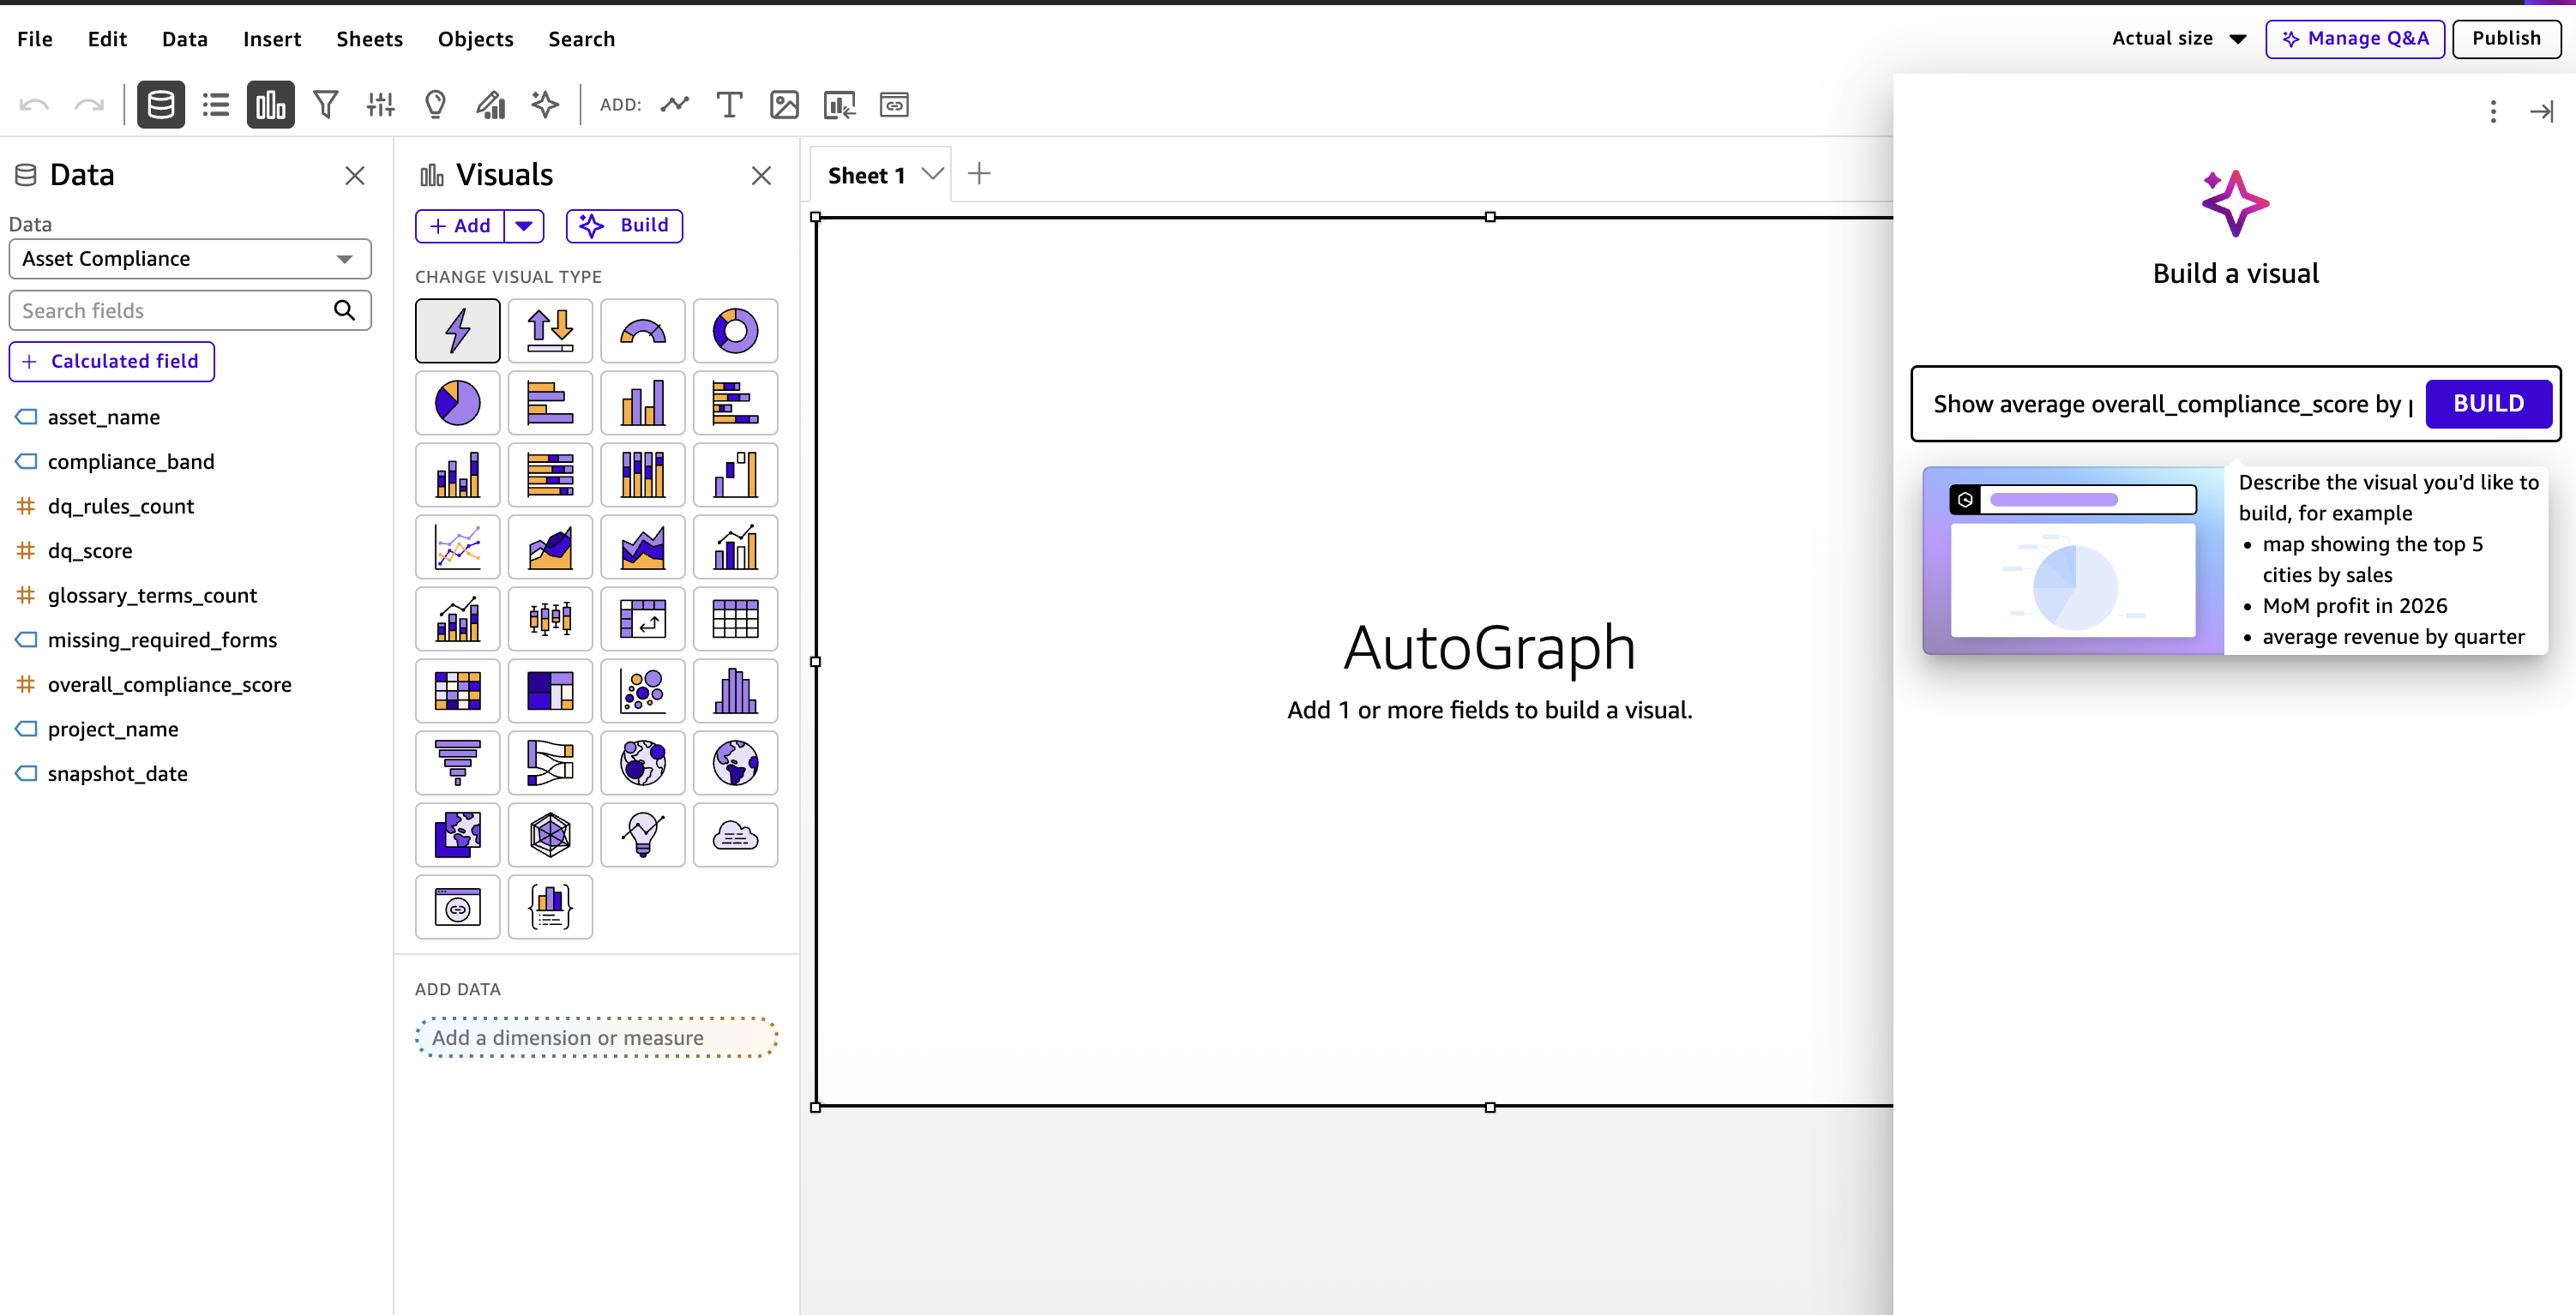
Figure 9: Building a visualization with a natural language prompt in the AWS Quick Sight analysis editor
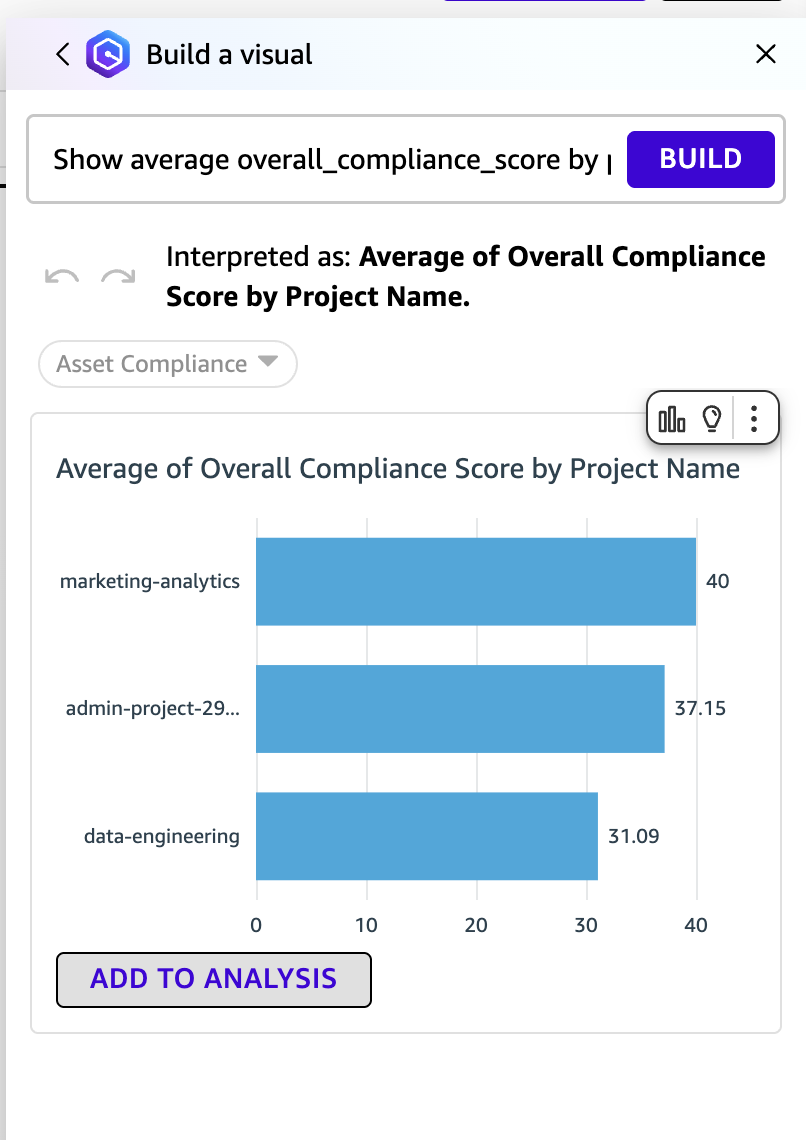
Figure 10: Natural language prompt interpreted as average compliance score by project
This produces an AWS Quick Sight dashboard built on top of the enriched table that delivers actionable governance, not raw metadata counts. Stakeholders see compliance scores, form gaps, and improvement trends without needing to understand the underlying API model.
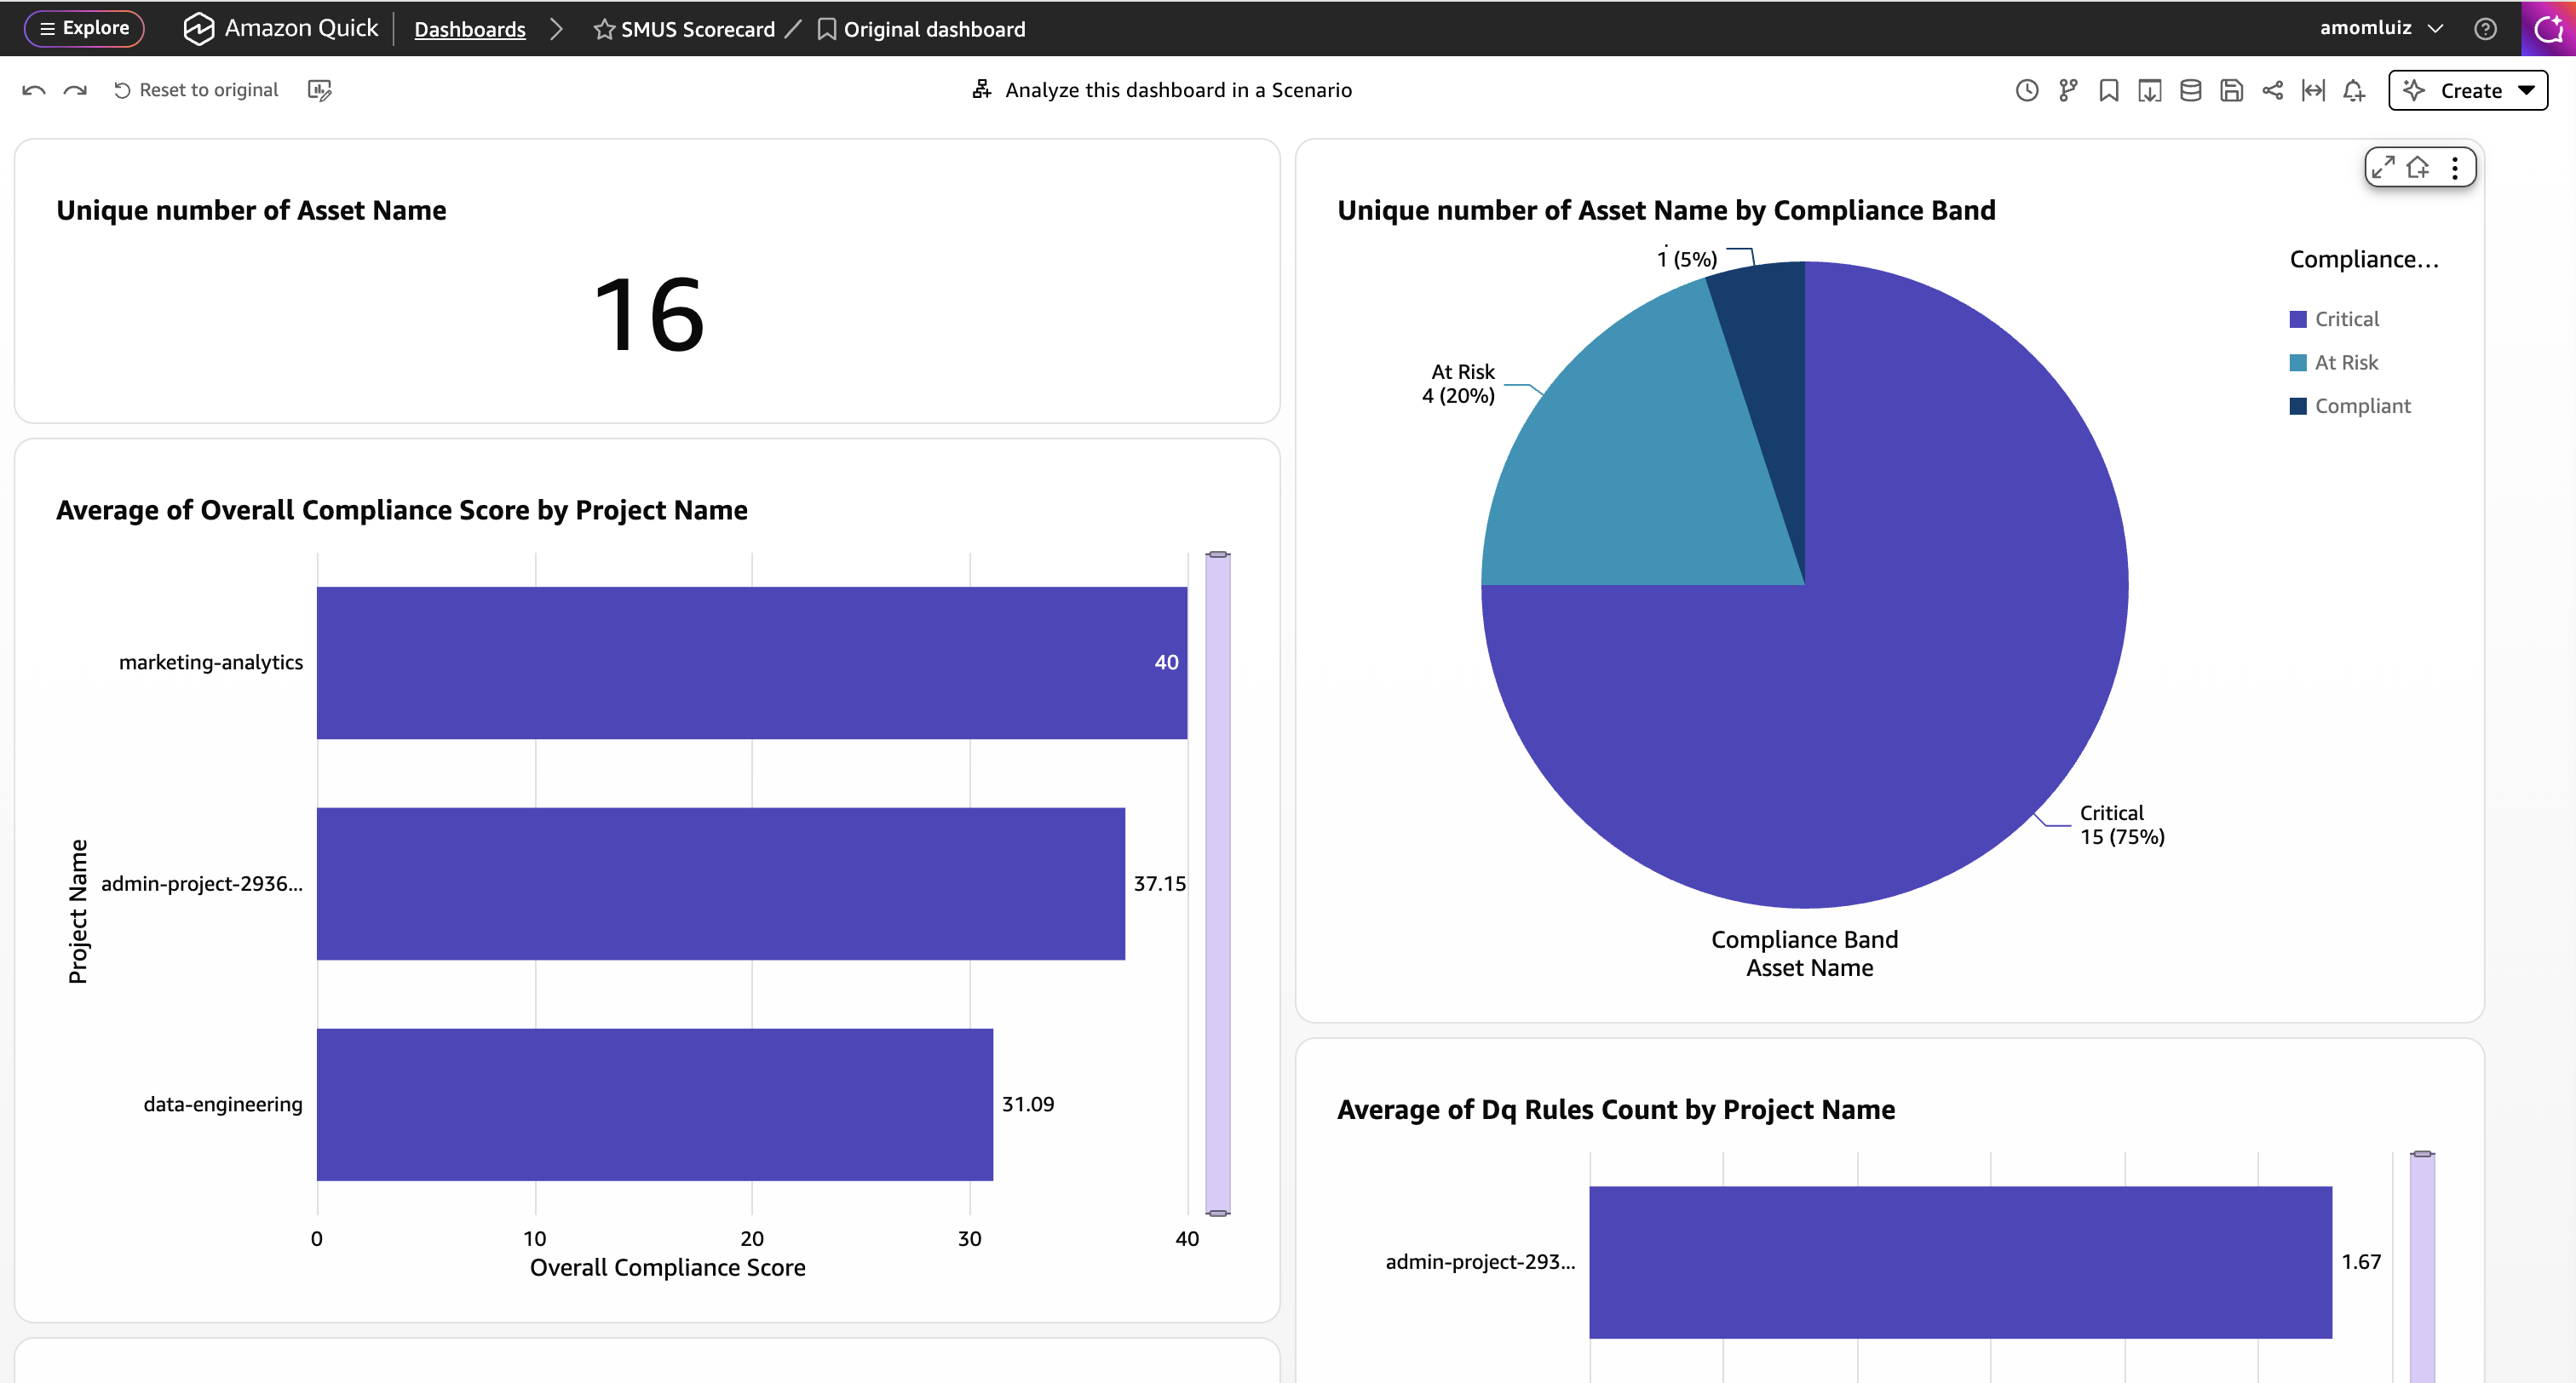
Figure 11: Average overall compliance score by project rendered as a bar chart
For a deeper walkthrough of the natural language Build approach applied to the raw export table, see Build governance dashboards for Amazon SageMaker Catalog with AWS Quick Sight. The same technique applies to your enriched compliance table with the richer signals added by this pipeline.
Part 7: Seeing the pipeline in action
To illustrate how to apply these concepts, consider a domain with 20 published AWS Glue table assets across three projects, each at a different governance maturity level. After the daily enrichment runs, querying the compliance table immediately surfaces the differences.
7.1 Per-project scorecard
Briefly, you can see which teams are investing in governance and which ones need attention. The marketing-analytics leads because its assets have metadata forms, glossary terms, and data quality rules configured, while the other two projects have only basic data quality checks in place.
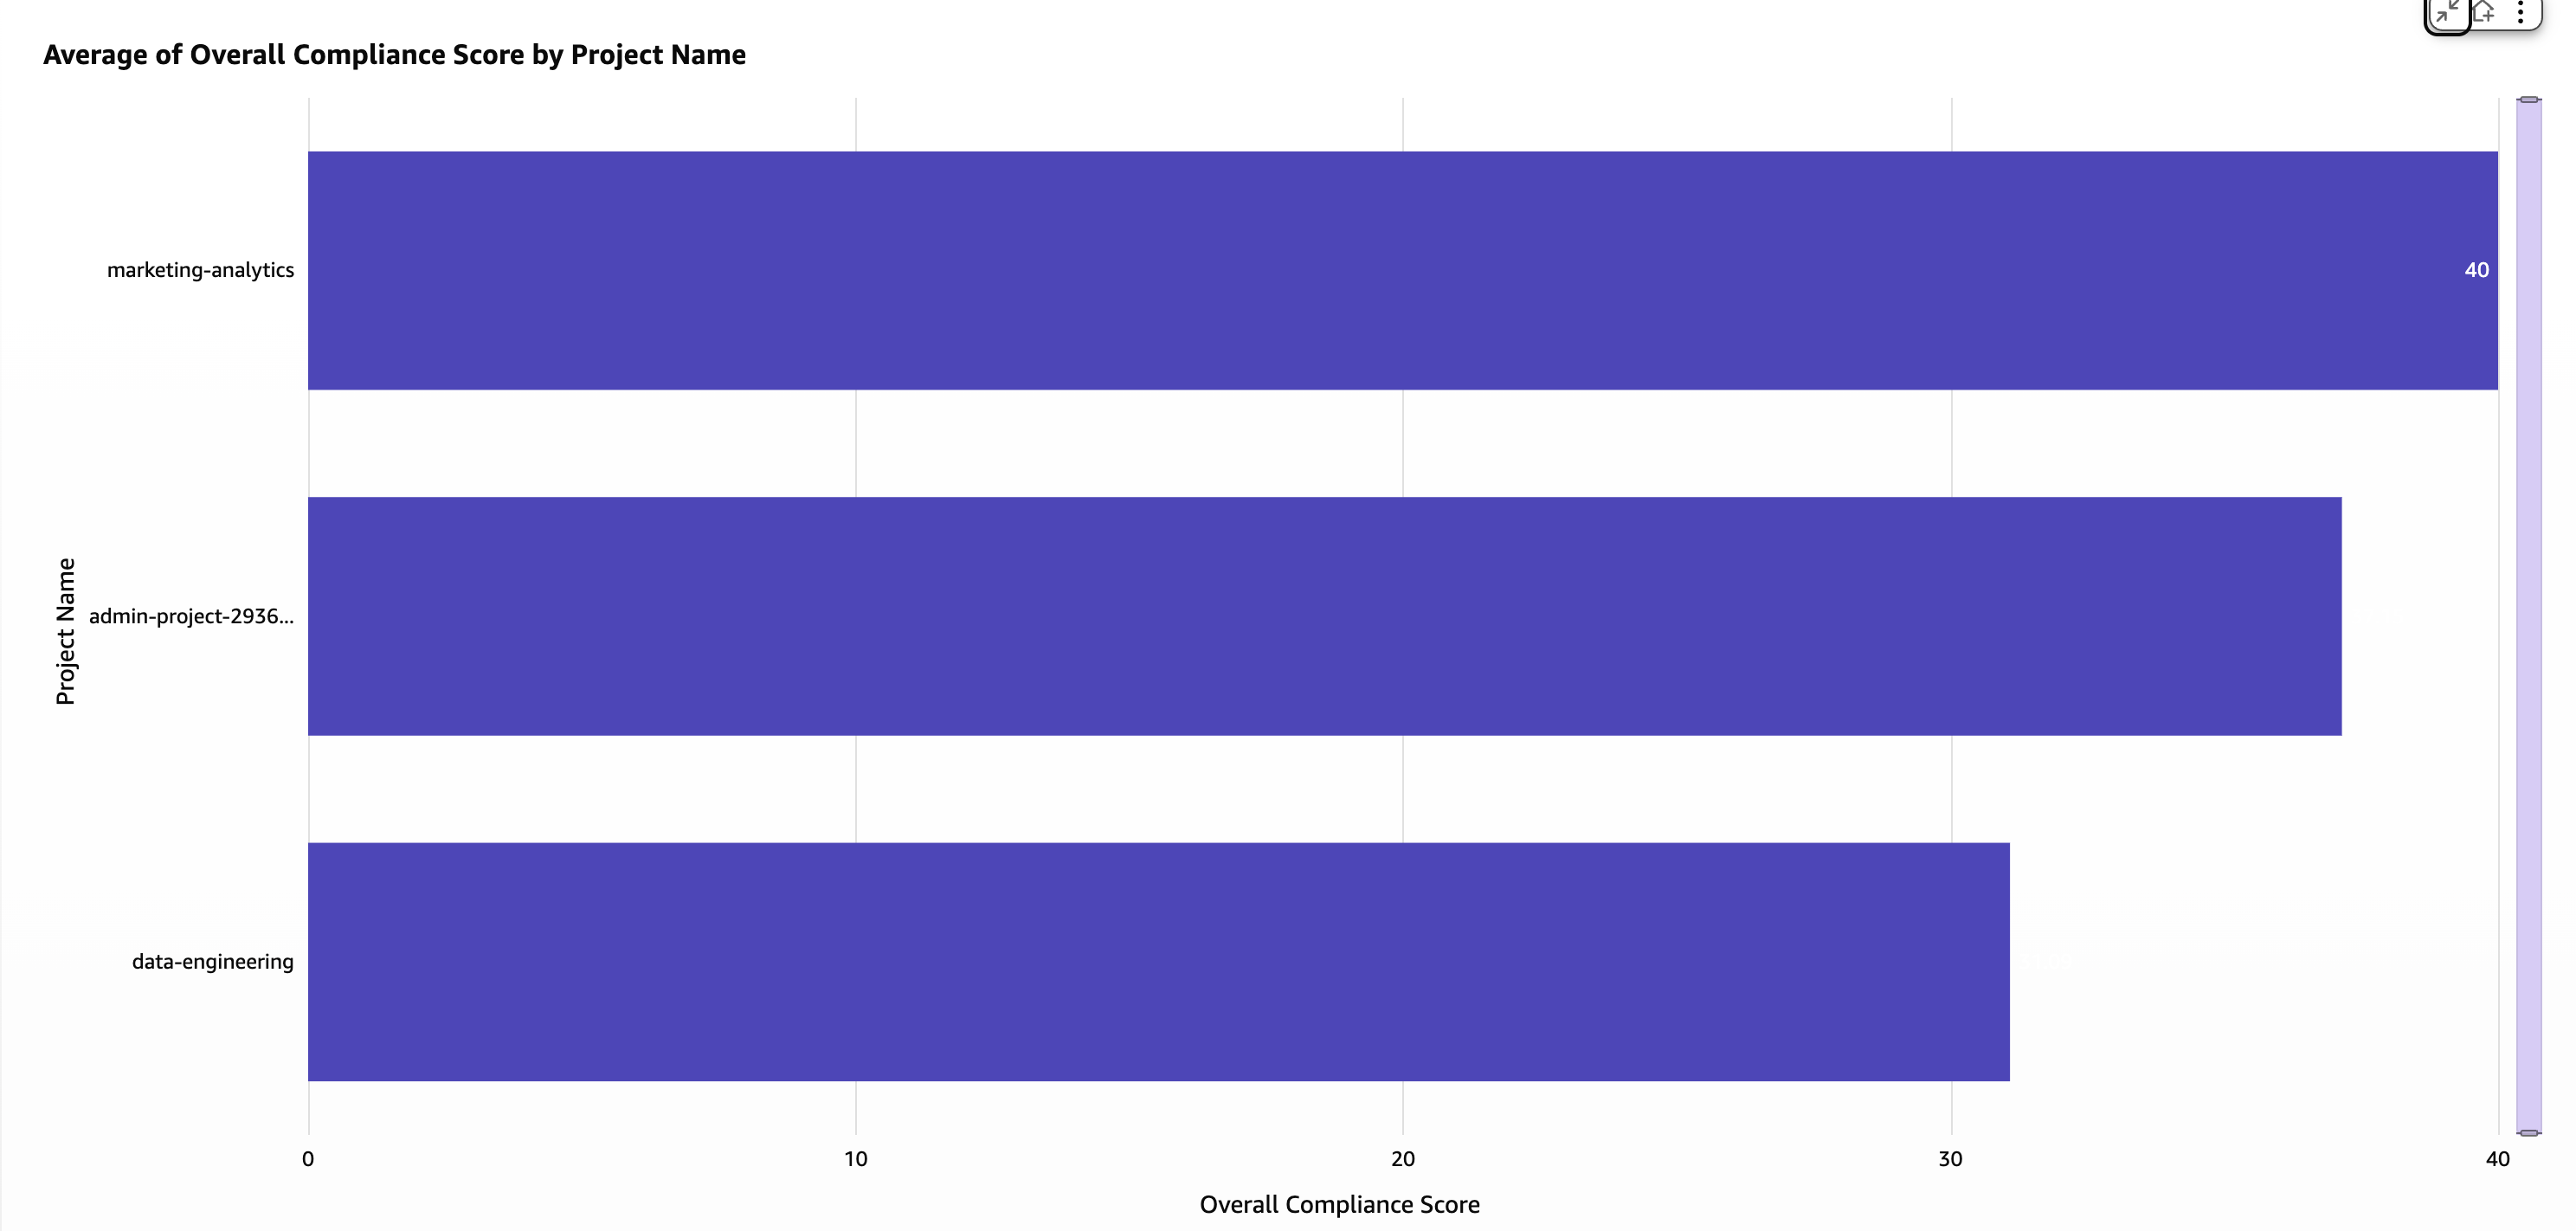
Figure 12: Per-project scorecard with compliance score and compliance band distribution
7.2 Drilling into individual assets
Based on compliance score defined previously as example, you can see the governance maturity into clear bands:
| Score | Band | Typical profile |
| 80–100 | Fully governed | All required forms present, glossary terms linked, data quality passing, description provided |
| 60–79 | Mostly governed | Required forms present, but missing either glossary terms or data quality coverage |
| 40–59 | Partially governed | Some required forms missing, or forms present but no glossary or data quality |
| 20–39 | Data quality only | Data quality rules configured and running, but no governance forms, glossary, or description |
| 1–19 | Minimally documented | Only a description present, but no forms, no data quality rules, no glossary |
| 0 | Ungoverned | No forms, no glossary, no data quality rules, no description |
The pipeline produces this output automatically on every scheduled run without manual intervention required. The Amazon EventBridge Scheduler fires daily, enriches the latest snapshot, and writes the compliance scorecard to the Iceberg table. A single Athena query then produces the per-project, per-asset view shown here.
Scalability note: in our test scenario with a domain of 29 published Glue Table assets across three projects, the enrichment Lambda completed in approximately 30 seconds. For organizations with larger domains and production environment, consider parallelizing asset enrichment calls and increasing Lambda memory allocation. For very large catalogs, a fan-out pattern using AWS Step Functions can distribute the workload across multiple Lambda invocations.
7.3 Consumption-weighted risk: who is using ungoverned data?
Compliance scores tell you what is below the required threshold. But not all compliance findings carry equal urgency. An asset with a score of 10 that five projects depend on might require immediate attention. The enrichment pipeline adds a subscription count per asset which represents the number of projects that have an approved subscription to consume it. This comes from the ListSubscriptions API, filtered by subscribedListingId (every published asset has a listing). Combined with the compliance score, it produces a risk matrix, as the following example shows:
| Quadrant | Compliance | Subscriptions | Recommended Action |
| Gold standard | >= 80 | High | No action: well governed and well adopted |
| Over-invested | >= 80 | Zero | Review: strong governance on unused assets |
| Backlog | < 50 | Zero | Plan: low risk, improve over time |
| Critical | < 50 | >= 2 | Act now: many consumers depend on ungoverned data |
The risk-view query joins both columns:
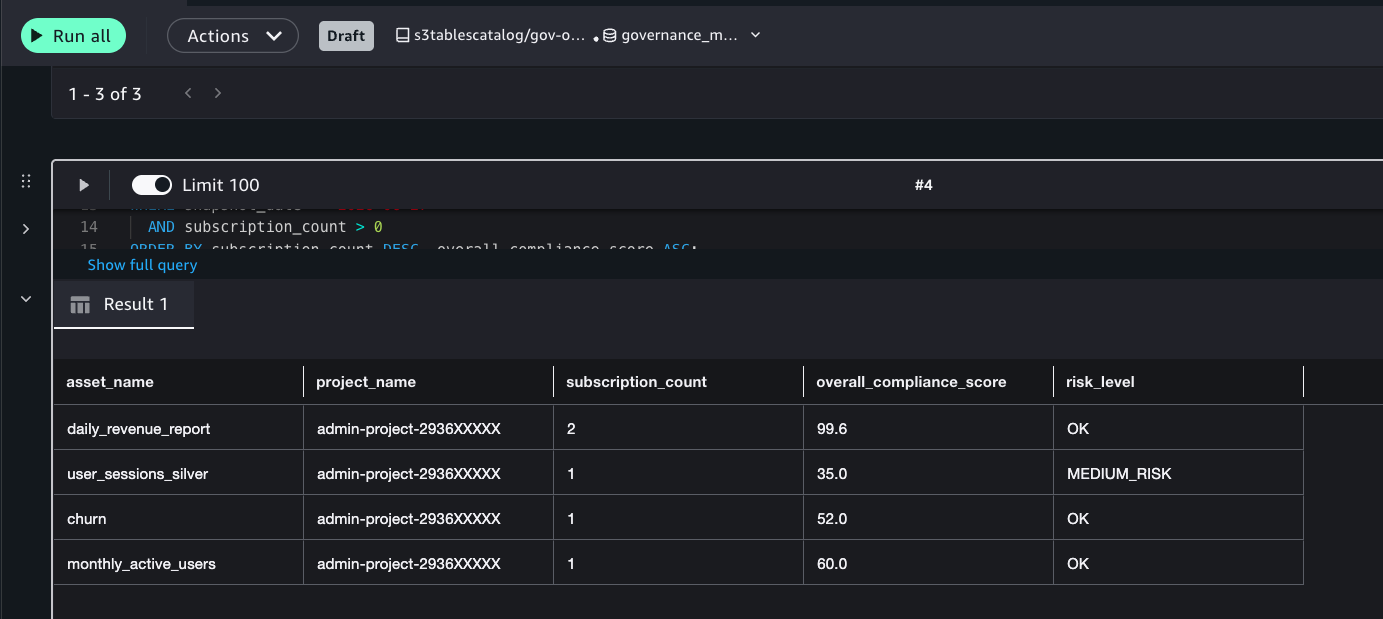
Figure 13: Risk query joining compliance score and subscription count to prioritize ungoverned assets
This turns your governance dashboard from a passive scorecard into a prioritization engine and asset teams know exactly where to focus based on both compliance gaps and downstream impact.
7.4 Extending to data products
With SageMaker Unified Studio, data producers can group related assets into data products, which are versioned, self-contained packages aligned to a business use case. Data consumers subscribe to a data product in a single request and receive access to all its member assets at once.
With this structure, you can aggregate compliance at the data product level. Build an asset_id -> data_product_name mapping by iterating over all projects. The data product scorecard query then rolls up compliance metrics across all assets in each product:
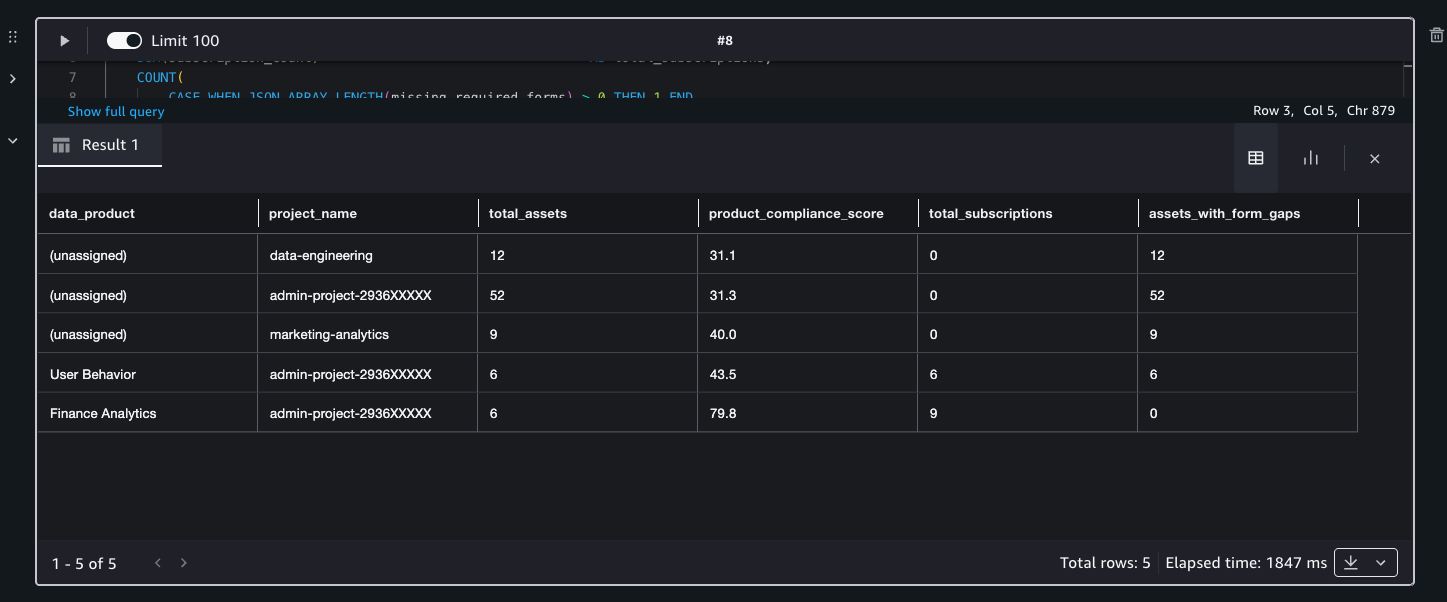
Figure 14: Data product compliance rollup across projects
This produces a compliance view at the level data consumers need: the products they subscribe to. A data product with a compliance score of 15 out of 100 and three subscriber projects is a potential governance incident, not a backlog item.
Cleaning up
If you deployed this pipeline in a test environment, delete the following resources to avoid incurring ongoing charges:
- The enrichment Lambda function and its associated IAM role.
- The Amazon EventBridge Scheduler rule.
- The
governance_metadataAWS Glue database and theasset_complianceS3 Table. - The S3 policy configuration file and any associated S3 bucket.
- The AWS Quick Sight dataset and analysis (if created).
- The Lake Formation permissions granted to the AWS Quick Sight service role.
The aws-samples repository has the commands needed to run the cleanup.
Conclusion
This post showed how to build a governance observability pipeline using Amazon SageMaker Unified Studio metadata exports and APIs, computes weighted compliance scores, and surfaces actionable governance insights through SageMaker Unified Studio queries and an AWS Quick Sight dashboard.
Amazon SageMaker Unified Studio provides the building blocks for governance such as asset type definitions, metadata form fields, data quality scores, glossary associations, subscription data, and a daily catalog export. This post demonstrates how to join those signals within Amazon SageMaker Unified Studio into a single enriched dataset to enhance data governance at scale.
The specific scoring model implemented here considering the five dimensions, their weights, and the risk classification by consumption is not prescriptive, but a starting point. Your organization’s governance policy might weight data product coverage more heavily, treat regulated project assets differently, or define “compliant” with a different threshold. The pipeline itself is the reusable part: after the signals are together, the scoring logic is yours to define and evolve.
Have questions about implementing this governance pipeline in your environment? Share your thoughts in the comments below or visit the aws-samples repository to contribute.