Amazon Bedrock provides access to foundation models from multiple providers through a common API, with AWS managing the model infrastructure. It integrates with AWS access controls and monitoring, and processes prompts, code, and model responses within AWS.
As coding agents move into production, changes in models and usage can affect latency, capacity, and cost. Amazon Bedrock runtime metrics in Amazon CloudWatch help teams investigate latency increases, throttling, and changes in token consumption. Evaluations, or evals, complement these operational metrics by assessing the quality of an agent’s work on a fixed set of representative tasks.
In this post, we show how Airbnb evaluates models for coding agents and monitors their use on Amazon Bedrock. We explain how cost per task guides model selection and how production data helps us revisit those choices as usage changes. We also describe the runtime signals used to investigate latency, throttling, and spend.
At Airbnb, thousands of engineers and engineering-adjacent people use AirChat, our internal tool for running coding agents, every week. The agents send their model requests through our large language model (LLM) gateway, which runs on Amazon Bedrock. Bedrock processes Airbnb’s code, prompts, and model responses within AWS. Eight new models came out in about five weeks. By mid-October, about two thirds of the requests our engineers sent through coding agents went to those new models.
Each release can change output tokens, cost, latency and capacity at once, and the benchmark charts published with a launch don’t show how a model handles our engineers’ work. So we run two systems side by side. Before a rollout, we run evals on our own tasks to measure each model’s score and cost per task. Cost per task is the list-price cost of all the tokens an agent uses to finish one task.
After a rollout, observability shows us what changed in production. When production usage doesn’t match the eval results, we find out why.
Solution overview
You can diagnose most production problems with a few signals in the AWS/Bedrock namespace in CloudWatch:
- Latency:
InvocationLatency,TimeToFirstToken,OutputTokenCount, and output tokens per second (OTPS), which you derive. - Throttling:
InvocationThrottles, plus the tokens each request reserves against your quota, which you publish yourself. Bedrock also publishesEstimatedTPMQuotaUsage, which measures your estimated tokens per minute (TPM) quota consumption, including cache write tokens and output burndown multipliers, across all inference APIs (Converse,InvokeModel,ConverseStream, andInvokeModelWithResponseStream). You can use this metric to set proactive alarms before reaching your quota limit, track your quota consumption across your models, and request further quota increases before usage is rate limited. - Cost:
InputTokenCount(uncached input),CacheReadInputTokenCount,CacheWriteInputTokenCountandOutputTokenCount, each priced at its own rate. Cache reads cost less than uncached input, and cache writes can cost more depending on the model. A lower cache hit rate can increase cost per request.
On top of these metrics, we add cost per task. Our evals measure a score and a cost per task for every model and every reasoning effort we allow. Reasoning effort is a setting that controls how much a model reasons before it responds. We use the results to choose each default, which is the model and effort that our coding tools use unless an engineer picks another, and each effort ceiling, which is the highest effort we allow for a model.
Architecture
Engineers run AirChat on their AirDev workspaces, which are personal development machines in the cloud. They can also hand a task to AirChat Remote, which runs cloud agents in separate cloud workspaces while the engineer does something else. Both paths go through our LLM gateway to Amazon Bedrock.
Figure 1 shows how AirChat and AirChat Remote reach Amazon Bedrock through our gateway. It also shows how evals and production monitoring guide model defaults and effort ceilings.
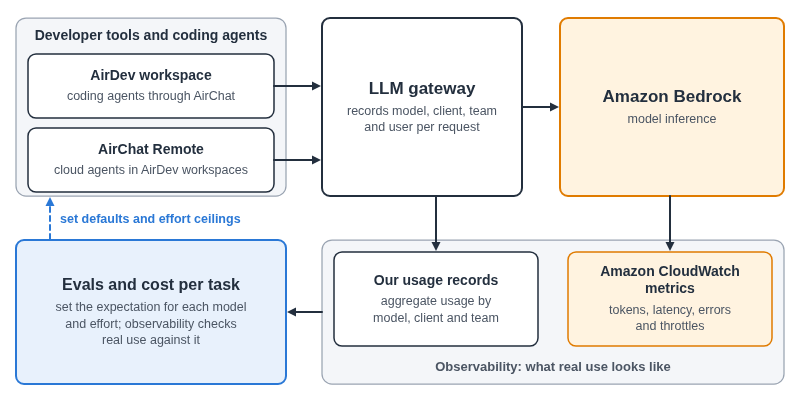
Figure 1: Coding agents and cloud agents call Amazon Bedrock through our LLM gateway. Our usage records and CloudWatch metrics show real use, and we use eval results to set defaults and effort ceilings
The gateway records the model, client, team, and user for each request. We use these records only in aggregate, for cost and capacity planning. CloudWatch supplies token counts, latency, errors, and throttles. We compare those production signals with our eval scores and cost per task to decide when defaults or effort ceilings need to change.
Prerequisites
On the AWS side, you need:
- Access to the models in Amazon Bedrock you plan to run and evaluate. For model availability by AWS Region, see Regional availability by models in the Amazon Bedrock User Guide.
- Streaming calls through
ConverseStreamorInvokeModelWithResponseStream. Bedrock publishesTimeToFirstTokenonly for the streaming APIs. - Model invocation logging, turned on in every AWS Region you call. It’s off by default. The logs can hold full prompts and responses along with the caller’s identity, so restrict who can read them and set a retention period.
Tagged IAM roles for your callers, with cost allocation tags activated. Activate them before you start collecting, because activation doesn’t backfill earlier costs.
You also need three things of your own:
- A set of tasks from your own engineering work. Give each one a starting repository state, the prompt an engineer would write and a grader you trust. A grader is the program or model that scores the agent’s work. We build our tasks from real code changes, the review comments on those changes and the decisions that the original ticket didn’t spell out. Step 2 shows one.
- A gateway or proxy in front of Bedrock that records the model, the client, the team, the user and the token counts for each request.
- A table of public list prices for every model you run, with a date on each entry, so you can price eval tokens and production tokens on the same basis.
Before rollout, define what the agents can access and which actions need human review. Run code in isolated workspaces and test generated changes before merging. Amazon Bedrock Guardrails can help filter harmful content and sensitive information in prompts and responses. For responses based on supplied reference material, contextual grounding checks can flag unsupported claims. Test these controls on your own tasks and include their latency and cost in your measurements.
Walkthrough
Start by measuring what a complete task costs. Then use those results to choose model defaults, check production behavior, manage capacity, and attribute spend.
Step 1: What does one finished task cost you?
A coding agent takes many requests to finish one task, and on each request the model re-reads the context so far. So we price the whole task.
Bedrock reports four kinds of tokens for each request: uncached input, cache reads, cache writes and output. In an eval run we price all four for every request and add up the requests in the task. Every cost in this post uses the public list prices dated for that run. We record the average cost next to the score for every model, reasoning effort and agent client we test, and the average includes low-scoring attempts.
Reasoning effort changes both score and cost. On one model we tested, moving from low to high effort raised the score by 0.8 points. Cost per task was 2.5 times as high. We use these results to set effort ceilings, which the gateway enforces.
Step 2: How fast can you evaluate a new model?
On the afternoon a new model came out, a single request to our agents started an eval campaign, which runs the new model through all our task suites. A suite is a fixed set of tasks of one type, and we have seven. Agents spread hundreds of tasks across the suites and several cloud workspaces, and each result appeared as soon as a grader scored it. First results arrived within hours. By the next morning, every suite had a score and a cost per task, and we had what we needed for a deployment decision for the entire org.
That speed depends on tasks that are already written down. Each task is a folder that holds everything one run needs. Here is a trimmed task from our machine learning work:
The grader recomputes the right answer from frozen data on every run, and the agent earns a reward of 1 only if every check passes. To test one model at every effort, list each effort as its own agent in a job config:
Both examples use the formats of Harbor, an open-source framework for running agent evals in sandboxes. It’s one option if you’re starting out.
Running the evals can be optimized. Writing the rubric, the scoring guide that a grader follows, is the hardest part. Our long tasks run over several rounds, with a simulated reviewer pushing back between rounds. A model grader scores each run on eight weighted dimensions. Each dimension gets a score from 0 to 3.
Because of ceilings like this one, an agent that needed rescuing can’t score well on polish alone.
Step 3: What do you watch after a rollout?
When latency rises, chart three signals before you open a support case: TimeToFirstToken for the wait before generation starts, OutputTokenCount for response length, and OTPS for generation speed. Bedrock has no native OTPS metric. You derive it with metric math, as the Amazon Bedrock User Guide describes:
In the example from our session, latency rose 40 percent while time to first token and OTPS stayed flat. Someone had changed the system prompt to ask for more thorough answers, and output tokens per request rose 50 percent. The model generated at the same speed and wrote longer responses. Treat prompt changes and model upgrades as deploys, and mark them on your dashboard.
Each week we put the CloudWatch runtime metrics next to the usage records from our gateway for each model. For cost and capacity planning, we also look at usage in aggregate: cost per request and the average number of requests per user each week. A new model can move both. After every rollout, we compare them with what we expected from the eval’s cost per task.
Step 4: The evals looked good. What did production show?
One model, which we call model A, looked good in our evals. On our coding tasks, it scored more than three points above our previous best model. Cost per task was about the same, and the same grader scored every model. We rolled it out, capped effort at high, and asked people to use low or medium for most work.
A few weeks after launch, we priced model A’s production usage at list price and looked at it in aggregate. Average weekly spend per user was several times higher on model A than on the model before it. Each model A request cost about three times as much, and the average model A user sent about three times as many requests.
Output tokens made up only a tenth of a request’s cost. Most of the cost went to cached context, which the model re-read on every request. Model A could work on its own for a long time, so people started long, self-directed sessions with it.
The eval measured the model on a task. Production measured how people chose to work with it.
Later, a newer model scored higher than model A on the same tasks and grader, at about a sixth of its cost per task. We moved model A’s users to it with a configuration change.
We then checked the change in aggregate on the same user group, the heavy users of model A. In their first full week on the newer model, the group sent about the same number of requests to their main model, and the group’s spend on that model fell to about a seventh.
Step 5: Why you get throttled, and where traffic goes next
On the bedrock-runtime endpoint, Bedrock checks your tokens-per-minute quota when a request arrives, before the model writes anything. It reserves your uncached input tokens and your cache writes, plus max_tokens, the most output the request is allowed. It adjusts that reservation as the model generates and returns the unused part when the request settles. Cache reads never count against the quota, so a request can be cheap against your quota and expensive on your bill. Output tokens settle at a burndown rate that is 1:1 on most models and several times that on some current models, so check your model’s rate.
A dashboard of billed tokens can show room while requests are being throttled. In our session’s example, the quota was 1 million tokens per minute and traffic was 300 requests per minute. The dashboard showed about 30 percent of quota. After applying a 5:1 output-token burndown rate, completed requests consumed about 77 percent.
Admission uses a different calculation. Each request initially reserved 600 uncached input tokens plus a max_tokens of 4,096, for a total of 4,696 tokens. Responses were about 800 tokens at p99.
Lowering max_tokens to 1,024 cut the initial reservation to 1,624 tokens, about 65 percent smaller. The limit was still above p99. For unchanged input and output, final quota consumption stays the same. The smaller reservation leaves more room to admit requests. Monitor stopReason to catch truncated responses. Use backoff and jitter, and cap retries.
Demand can also outrun the headroom you have on any one model. You want to know where work can go before you need it, and our evals answer that. The answer can be a model from another model family. For every major model we use, we keep at least one equivalent that performs as well on our evals and that we can load-balance to. Without those evals, choosing where the work goes would be guesswork.
If headroom on a model stays tight, we can rebalance by changing a default in our configuration. First check that the equivalent model has capacity for the extra load and that your quota covers it. Keep enough traffic on it to hold your access, too: after a model enters its Legacy period, existing customers can lose access after 15 days of inactivity. A Legacy model works until end-of-life, and after that Bedrock removes it from every Region, requests to it fail, and Bedrock doesn’t move your traffic automatically. Alarm when LegacyModelInvocations rises above zero.
Step 6: Whose spend is it?
Bedrock runtime metrics are dimensioned by ModelId, so you can see which model served a request but not which team sent it. Bedrock publishes these metrics both with and without the ModelId dimension, and a request that fails before Bedrock resolves the model appears only in the series without it, so filtering by ModelId undercounts errors. Bedrock offers three ways to attribute spend:
- Which team or user? Bedrock records the caller’s IAM identity on every request. Tag your roles, or pass session tags, to see cost by tag in AWS Cost Explorer and the AWS Cost and Usage Report (CUR 2.0).
- Which application? Application inference profiles are model-specific, so create one tagged profile per application and model, and call the matching profile’s ARN.
- Which feature or prompt? Pass key-value pairs in
requestMetadataonConverse. Bedrock writes them to the model invocation logs and leaves them off the bill. To price them, multiply the token counts in the logs by the published rates. Neither classic CUR nor CUR 2.0 carries a per-request ID, so reconcile the two by comparing totals by model, usage type and time period.
Behind a gateway, Bedrock sees the gateway’s role, so have the gateway assume a role for each user with its own RoleSessionName or session tags. Cache those credentials for the session, because assuming a role on every request can exceed your AWS Security Token Service (AWS STS) rate quotas. Requests keep succeeding when attribution breaks, so set an alarm for when Bedrock fails to deliver invocation logs.
Our usage records let us attribute usage by model, client, team and user, which we use only in aggregate for cost and capacity planning. We compute cost per task from the same four token counts, so we can compare token mix and cost between our evals and production.
Results
We can go from a model release to a deployment decision overnight. After one rollout, average weekly spend per user on model A was several times that on the previous model. We moved its heavy users to a newer model. In their first full week, the group’s spend on its main model fell to about a seventh, with roughly the same number of requests. For every major model we use, our evals identify an equivalent we can rebalance to.
Clean up
After testing, stop the eval jobs and agent processes you started. If you enabled model invocation logging only for this walkthrough, disable it in each Region using DeleteModelInvocationLoggingConfiguration.
After callers no longer use them, delete the application inference profiles you created using DeleteInferenceProfile. Remove IAM roles, policies, and resource tags created only for this walkthrough. Deactivate cost allocation tags used only for these tests. Delete test CloudWatch log groups and S3 log objects you no longer need.
Conclusion
We run four checks every time a model ships:
- Release day: run the new model on your own tasks at every effort, and record a score and a cost per task together.
- Before rollout: choose the default and cap effort from those numbers. Block any effort that costs more and scores less than a lower effort.
- First weeks: compare cost per request and average requests per user with the eval’s cost per task, pricing both from the same four token counts.
- Before you need it: know which models score the same on your evals, from any model family, and check their capacity and your quota before you rebalance.
We chose Amazon Bedrock for access to multiple model families through one API. It lets us use our existing AWS access controls and logging while AWS manages the model infrastructure. We use evals to choose models for our work and observability to know when those choices need another look.
To go further, see these pages in the Amazon Bedrock User Guide:
- Monitor runtime metrics in CloudWatch
- Diagnose latency with output tokens per second
- How tokens are counted
- Prompt caching
- Track usage and costs
- Monitor model invocations with logs
- Model lifecycle


