When blocked requests spike or a customer reports being locked out, a security team has to work out what is happening, where it is happening, and if AWS WAF is making the right call. Currently, that usually means opening each protection pack (web ACL) in turn, across domains, AWS Regions, and Amazon CloudFront distributions, or querying AWS WAF logs. In 2024, we introduced the AWS WAF traffic overview dashboard, which gives you a near real-time view of each protection pack (web ACL). Today, we’re introducing the AWS WAF security analytics dashboard: a single global page that you can use to investigate traffic across all of your protection packs (web ACLs), Regional resources, Amazon CloudFront distributions and then act on what you find. The dashboard can help you investigate and contain threats faster and reduce false positives that block real customers. You don’t need to build or maintain your own log analytics pipeline to do it.
In this post, we introduce the new dashboard and walk you through two use cases: investigating a traffic spike, and tuning your rules to reduce false positives.
Introduction to the security analytics dashboard
To open the dashboard, go to the AWS WAF console and choose Security analytics in the navigation pane. The dashboard shows request data across all protection packs (web ACLs) in your account. You can narrow it to specific protection packs (web ACLs) and set the time range. As shown in the following figure, at the top of the page, you can see total requests split by action (Allow, Block, CAPTCHA, and Challenge). The Requests chart shows how the traffic changes over time. Below that, traffic breakdown widgets show the top values for each dimension. The dashboard is built on full-fidelity request data, not samples.
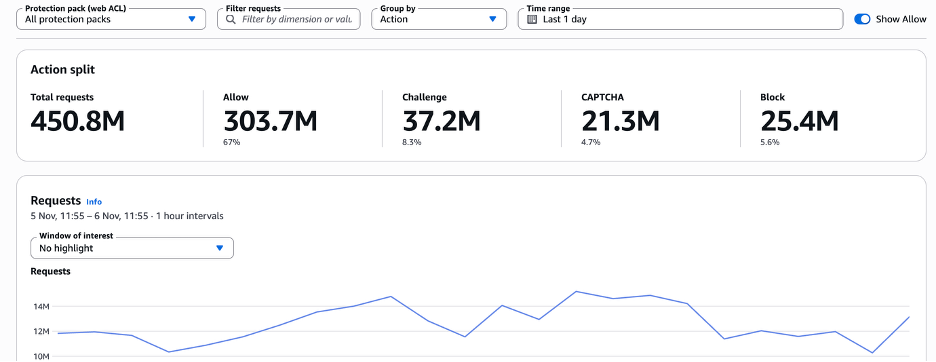
Figure 1: The security analytics dashboard across all protection packs
Dimensions
You can filter, group, and break down traffic by dimensions that include, but aren’t limited to, the following:
- Who’s sending traffic – Client IP, country, Autonomous System Number (ASN), user-agent, and JA4 TLS fingerprints
- What they’re requesting – Host, path (URI), protected resource (Amazon CloudFront distribution, AWS Application Load Balancers, and others), Region, or protection pack (web ACL)
- How AWS WAF responded – Action, rule triggered, labels, or response code
We’ll continue to add dimensions to the security analytics dashboard over time. The rest of this post refers to the preceding dimensions by the names used here. Two dimensions deserve a closer look:
- Host – Many customers think about their applications by domain rather than by protection pack (web ACL). Grouping or filtering by Host will show you which of your domains are under attack or if a spike is hitting www, the API, or a staging site, even when one protection pack (web ACL) protects several domains or one domain spans several protection packs (web ACLs).
- Labels – Labels are metadata that AWS WAF rules add to the requests they inspect. AWS Managed Rules for AWS WAF add them (for example, Bot Control labels for bot category, verification status, and signals such as
non_browser_user_agent), and you can create rules to add custom labels. Because labels are recorded even when a rule only counts, filtering by a label shows you what a rule detected across all of your protection packs (web ACLs), without changing how your traffic is handled.
Controls
The dashboard is built around a few controls:
- Filter requests – Combine conditions on any dimension, using Equals or Does not equal. Filters apply to the whole dashboard: the action split, the Requests chart, every widget, and the request list update to match. Your dashboard view is saved in your browser.
- Group by – Split the Requests chart by any dimension, such as Host, Rule triggered, Country, or JA4, to see how traffic changes over time.
- Show only, Exclude, and Block – Select any value in any widget to focus on it, remove it from view, or block it. For example, you can block a high-risk or unexpected IP address, or block traffic from a country, directly from the dashboard.
- Requests and detections – Review the individual requests behind the charts. For each request, see HTTP request fields such as host, path, headers, user agent, and JA4 fingerprint. You can also see which detections and labels matched and whether each action was enforced or only counted . Previously, this level of detail meant working from a limited sample of requests or setting up and querying your own AWS WAF logs. Now it’s available directly on the dashboard.
Together, these controls help you answer questions such as:
- What share of traffic across all your protection packs (web ACLs) and domains is being blocked, challenged, or allowed, and how is it changing?
- Which rules are doing the most work, and are any of them blocking legitimate users?
- Which IP addresses, ASNs, JA4 fingerprints, or countries are behind a spike, and what are they targeting?
- How much of your traffic comes from bots, and are the bots verified?
Use case 1: Investigate a traffic spike
Suppose you receive an alert that blocked requests have increased. To investigate:
- Go to the Security analytics page in the AWS WAF console and select All protection packs.
- Assess the scope: The action split shows the overall block rate. Group the Requests chart by Host to see which domains are affected and check the Protection pack widget to see whether one application or several are involved. A campaign hitting your storefront, API, and media domains at the same time calls for a different response than a problem on a single endpoint.
- Identify the source: Group the Requests chart by Rule triggered to see which rules are mitigating the traffic and when they started firing. Then check the source and request dimensions. If one IP address sends a disproportionate share of requests, or many IP addresses share one JA4 fingerprint, the traffic likely originates from a single automated actor.
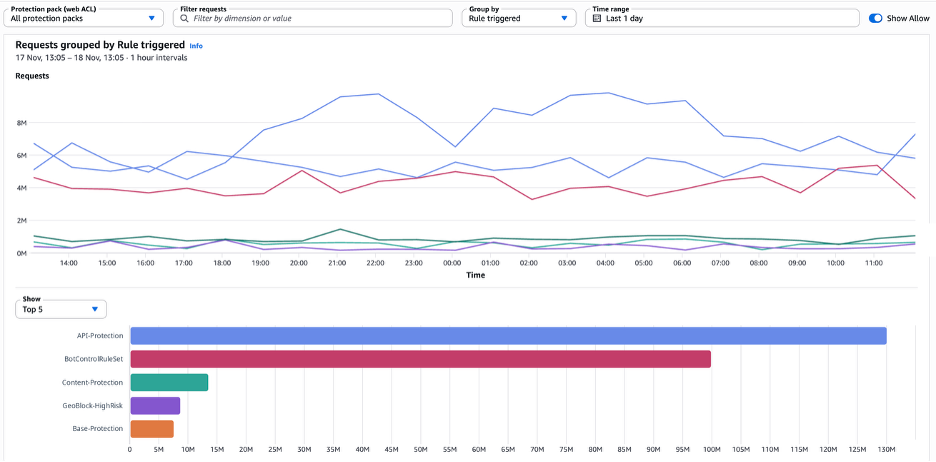
Figure 2: Requests grouped by Rule triggered, showing which rules fired and when
- Confirm with request-level evidence: When you find an unexpected value, select it and choose Show only to filter the entire dashboard to it.
- Then confirm what you’re seeing in Requests and detections. Expanding a request shows all its details, including the HTTP request fields. For example, a curl user agent with no Accept-Language header, coming from a cloud hosting ASN, is likely automated traffic.
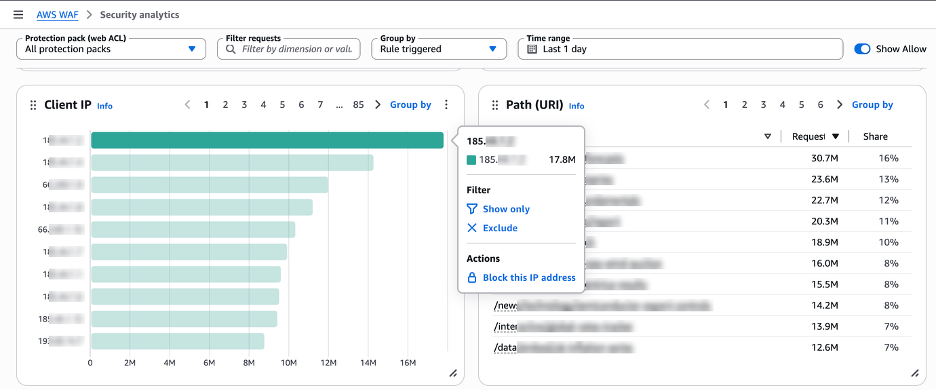
Figure 3: Show only, exclude, or block it
After you confirm the source, choose a response that fits the traffic:
- One clear source: Choose Block this IP address directly from the dashboard. Use a geographic block only if you don’t expect legitimate customers from that country.
- Traffic spread across multiple IP addresses: Add a rate-based rule with a custom aggregation key such as JA4, or use AWS WAF Bot Control.
- Known bad actors and application-layer floods: Add the Amazon IP reputation list and the Anti-DDoS managed rule group.
- Faster detection time: Create Amazon CloudWatch alarms on AWS WAF metrics. For details, see Monitoring with Amazon CloudWatch.
When the change is in place, return to the dashboard to confirm that requests from that source now show the Block action.
Use case 2: Tune your rules and reduce false positives
Rules can fail in two ways: by blocking legitimate users, or by only counting traffic that they should stop. Filters and labels help you find both.
If you suspect that a rule is blocking a broad population, such as many distinct clients sending only a few requests each, enter Rule triggered = <rule name> in Filter requests. The dashboard shows only the requests that the rule acted on. Review the Country, Host, and Path (URI) breakdowns to understand who the blocked clients are and what they requested. If the blocked clients look like your typical customers, with common browsers, expected countries, and checkout or login paths, consider adding a scope-down statement to the rule or changing the action to Challenge.
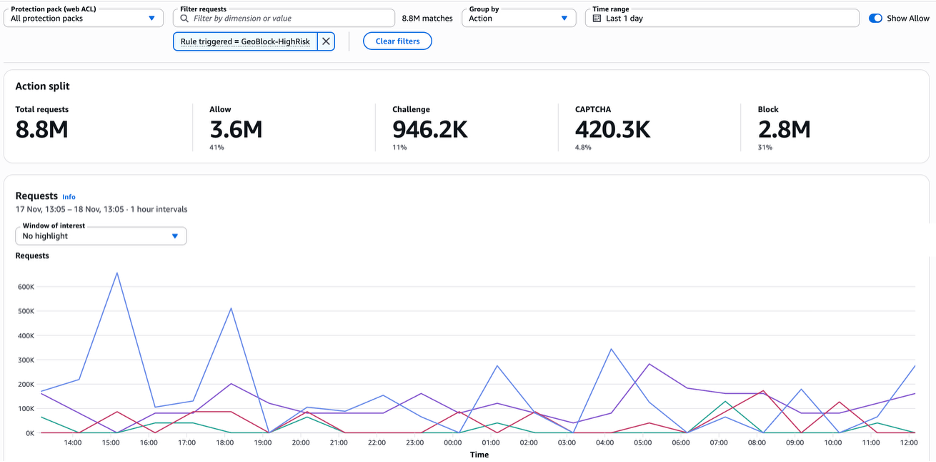
Figure 4: The dashboard filtered to a single rule with Filter requests
Evaluate rules before you enforce them: When you evaluate a managed rule group in Count mode, filter by its labels to see exactly which requests each rule matched. For example, filter by a Bot Control label such as awswaf:managed:aws:bot-control:bot:unverified, then check Host, Path (URI), and User-Agent to see what those bots are after. Use Exclude on labels for known-good traffic, such as bot:verified search engine crawlers, to keep them out of your review.
On the Detections tab of Requests and detections, rows marked Counted, not enforced show what a rule would block. If the matches aren’t partners or monitoring tools, consider changing the rule action to Block.
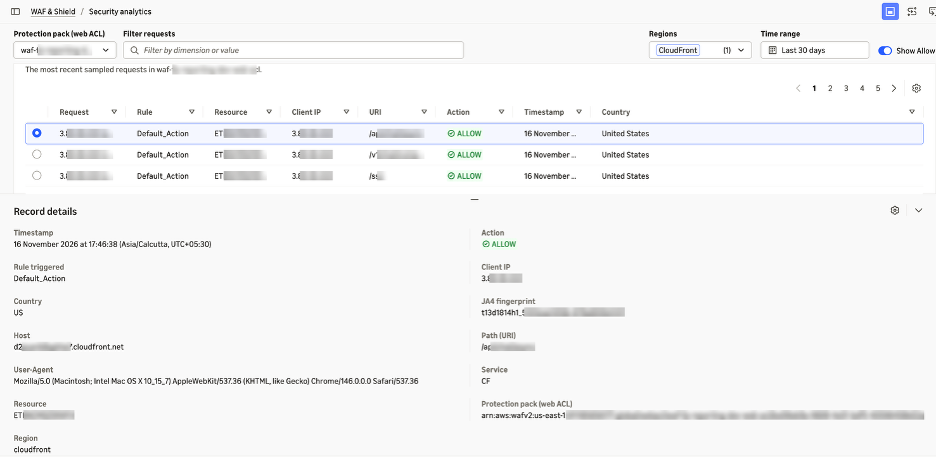
Figure 5: Record details for a single request, including host, JA4 fingerprint, and protection pack
After you change a rule, compare the same time window on the dashboard to confirm that the rule now affects only the traffic you intended.
Conclusion
The traffic overview dashboard shows you what changed in each protection pack (web ACL). The security analytics dashboard helps you understand why it changed, and lets you act on it from the same page, across all of your protection packs (web ACLs), domains, Regions, and Amazon CloudFront distributions. Filters, grouping, and labels explain the traffic, and request-level evidence helps you act with more confidence. Together, they can help you investigate faster, reduce how often real users are blocked by mistake, and confirm that each rule changes affect the traffic you intend.
The security analytics dashboard is available at no extra cost in all AWS Regions where AWS WAF is offered, and shows up to 21 days of request data. To get started, open the AWS WAF console and choose Security analytics.
If you have feedback about this post, submit comments in the Comments section below.
Related reading
To learn more about visibility and bot management in AWS WAF, see the following resources:
- Introducing the AWS WAF traffic overview dashboard
- Introducing AI traffic analysis dashboards for AWS WAF
- How to manage AI bots with AWS WAF and enhance security
- AWS WAF announces AI traffic monetization
If you have questions about this post, contact AWS Support or start a new thread on AWS re:Post.


