We put the scheduled Spark compaction job that most Iceberg teams write on a table taking a MERGE every 200 seconds for two hours. It tried three times. It committed zero times.
Cryo, running on the same cluster against the same table, committed 22 times out of 22.
That gap is what this post is about. Iceberg tables don't fail loudly. They rot. Every streaming write leaves another small Parquet file, every commit adds a snapshot, and failed jobs leave orphan files you still pay to store. Row-level updates pile up delete files. No single write is a problem, but after a few weeks queries slow down and storage grows.
I've been building Cryo for Iceberg (https://github.com/tech-pw/cryo). It's free and open source (Apache 2.0, self-hosted, no paid tier). It grades every table A–F and runs the maintenance on the Trino or Spark you already have. (The "for Iceberg" matters: there's an unrelated cryo on PyPI.) Below: what goes wrong in Iceberg tables, how Cryo decides what to fix, and what we measured, including where Cryo loses.
What decays, and what fixes it
Iceberg ships the repair procedures already. Each kind of decay has its own fix:
- Small data files →
optimize/rewrite_data_files - Delete files from MERGE/UPDATE →
convert_deletes,rewrite_position_deletes(Spark only) - Stale column statistics →
compute_statistics - Manifest bloat →
optimize_manifests - Snapshot pile-up →
expire_snapshots - Orphan files →
remove_orphan_files
The hard part isn't calling these. It's deciding which tables and partitions need them, when to run them, and on which engine, without knocking over the cluster that serves your dashboards.
The usual setup
A common setup is an Airflow DAG that computes stats, a second DAG that runs per-table dbt maintenance, and macros holding the real logic. It runs every procedure on every table every cycle. Nothing shares state and there's no UI. If you want to fix one table right now, you hand-edit a macro. A full-table OPTIMIZE on a big table can take a Trino cluster down.
Step 1: grade the table from metadata
Cryo's scanner reads catalog metadata only, never data files. For each table and partition it records file counts and sizes, snapshot and manifest counts, and delete files. It scores the table against 14 checks. Every table starts at 100. A critical finding costs 20 points and a warning costs 8, and the count limits grow with table size. The bands are A from 90, B from 75, C from 60, D from 40, and F below 40.
The README shows a worked example. analytics.events loses 20 points for small-file fragmentation (62.3% small files, fixed by optimize), 8 for snapshot buildup (184 snapshots, fixed by expire_snapshots) and 8 for manifest bloat (212 manifests, fixed by optimize_manifests). That leaves 64, a C. Every deduction names the operation that wins the points back, so the grade is a to-do list rather than a vanity score.

Step 2: plan partition by partition
The planner works from stored scan data, not live $files reads. It ranks partitions by small-file count and skips the ones under the threshold. It then packs the rest into chunks under a GB budget and caps the partitions per chunk. A partition over budget runs alone. That's how it avoids sending a whole-table OPTIMIZE.
The plan holds no SQL. It holds operations and partition predicates. Trino and Spark each have their own renderer with golden tests, so one plan becomes either ALTER TABLE ... EXECUTE optimize WHERE ... or a Spark rewrite_data_files call with the same predicates.
Step 3: admit work only when the engine has room
Before a job starts, a governor runs a set of checks. Is the table paused? Is it inside its cooldown or off-peak window? Is it already locked by another job? Then it reads live engine load from Trino's system.runtime.queries and only admits the job into a free slot. Adding Cryo workers doesn't add parallel rewrites, because engine headroom sets concurrency. A job that fails a check is deferred with a reason.
Step 4: run in a fixed order and log everything
Seven operations always run in the same order. Compaction comes first (convert deletes, rewrite position deletes, optimize), then statistics, then cleanup (manifests, snapshot expiry, orphans). That way one run reclaims the space its own compaction freed. Every action writes an audit row with the table, operation, engine, status, duration and actor, including runs that were deferred or failed.
What we measured
We benchmarked Cryo against what teams actually run: a scheduled Spark DAG that compacts, rewrites manifests and expires snapshots on every table, every cycle. Every contender used the same stack (Spark 4.1 and Iceberg 1.11 on Kubernetes). We ran 3 trials per test and report 95% confidence intervals. Every row was fingerprinted before and after. Trino was used read-only for all query timing, and Cryo ran on default settings. The protocol was written and frozen before any scored run.


- A mixed fleet (healthy, quiet, fragmenting, badly fragmented and row-updated tables) over 4 cycles. The DAG made 48 unnecessary rewrites per trial and Cryo made 10, none of them on healthy tables. Both left the fleet 100% healthy.
- A 100 GiB table fragmented the way streaming ingestion leaves it. One Cryo run took it from 7,594 data files to 690. Queries got 1.76x faster (geometric mean of the whole mix), and up to 4.34x on single queries. The output matched an engineer running the same Spark SQL by hand: 690 files and the same bytes.
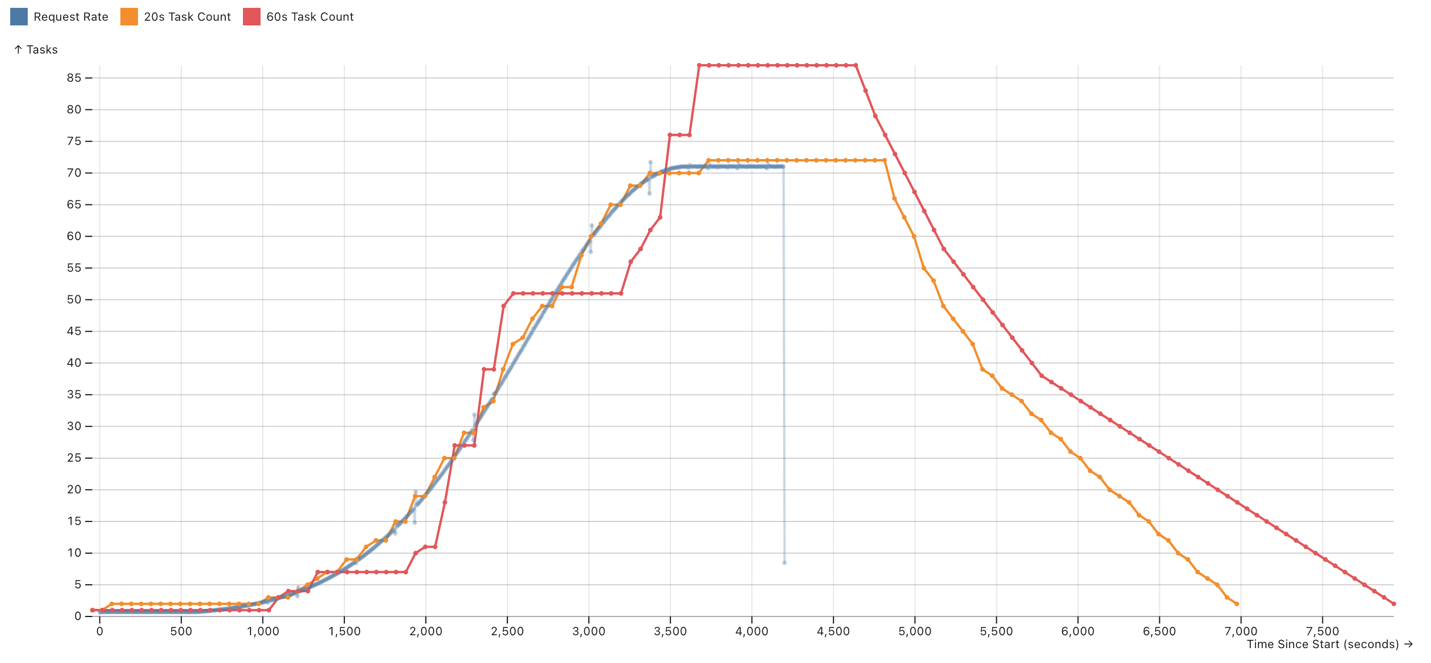
- Live CDC: a MERGE every 200 seconds for 2 hours. All three of the DAG's compactions failed on commit conflicts. Cryo's 22/22 jobs succeeded, and it held the table at 3 to 6 delete files from its second run.
- User impact: dashboard-style Trino queries ran while Cryo rewrote 67 GiB. Their p95 stayed between 0.88x and 1.04x of idle, with zero failures.
Across all tests, 151/151 Cryo jobs succeeded and 0 rows were lost or changed.
What it costs
A benchmark that only shows wins isn't worth much, so here are the losses:
- About 2x the DAG's Spark compute on small tables, and 1.67x hand-run SQL on the 100 GiB table. Cryo starts one Spark application per operation, so it isn't a compute saver.
- Single-row lookups got 1.8x slower at 256 MB files, because each lookup opens a bigger file. If your workload is mostly point reads, use a smaller target.
- Jobs waited a median of about 3 minutes in the queue. That's fine for maintenance, but Cryo isn't built for second-level reaction.
- The benchmark only compares Spark-based contenders, and the CryoBench V2 harness isn't in the repo yet. We're working on publishing it.
Full results: https://tech-pw.github.io/cryo/benchmark/

Status
Cryo is pre-1.0. Trino and Spark/EMR are GA, a native Go compactor is in beta, and Flink only generates config. Supported catalogs are Iceberg REST, Apache Polaris, Project Nessie, Hive Metastore and AWS Glue. To try it locally (you need Docker, Python 3.12+ and Node 22+):
git clone https://github.com/tech-pw/cryo.git cd cryo ./start-local.sh start If you run Iceberg in production, I'd like your help with two things:
- Tell me your worst table's grade. Run Cryo against a catalog, or just tell me the table's small-file share and snapshot count in the comments, and I'll say what Cryo would plan for it.
- Tell me where it's wrong. Issues are open at https://github.com/tech-pw/cryo. If it's useful, a star helps other Iceberg teams find it.