
A new customer handed us a large automation codebase and vague answers to our questions. I read through it, turned it into two diagrams, and circled every unknown in red. Those red circles became a list of questions the customer agreed to answer, and the answers made the design decisions possible. Here's how that worked.
The problem: vague answers, a lot of code
Every new project starts with discovery. You ask how the system works, what it needs, and who owns what. In government cloud, the first answers are often vague. That isn't anyone's fault. The people on the call may not have built the system. Data agreements may not be settled. Policy may still be moving.
On this call, the customer's real answer was their automation: an Ansible collection that builds and configures a Kubernetes platform. It created a lot of resources, and there was a lot of code behind it. It was the most accurate description of the system that existed. But it was long, spread across many roles and files, and nobody had time to study it properly.
So the team had two choices. Design from the vague answers and hope, or read the code.
Reading the code nobody wanted to read
I read it. Not every line in depth, but enough to follow the path from "run the playbook" to "the platform is up". I asked two questions as I went:
- Where does each workload run, and why there?
- How does a user or a service prove who it is, and to what?
Automation is honest in a way that slide decks are not. It can't be vague. Every node, label, certificate and setting is written down somewhere. The hard part is that it's written down in hundreds of places.
Two diagrams, two questions
I turned the reading into two diagrams.
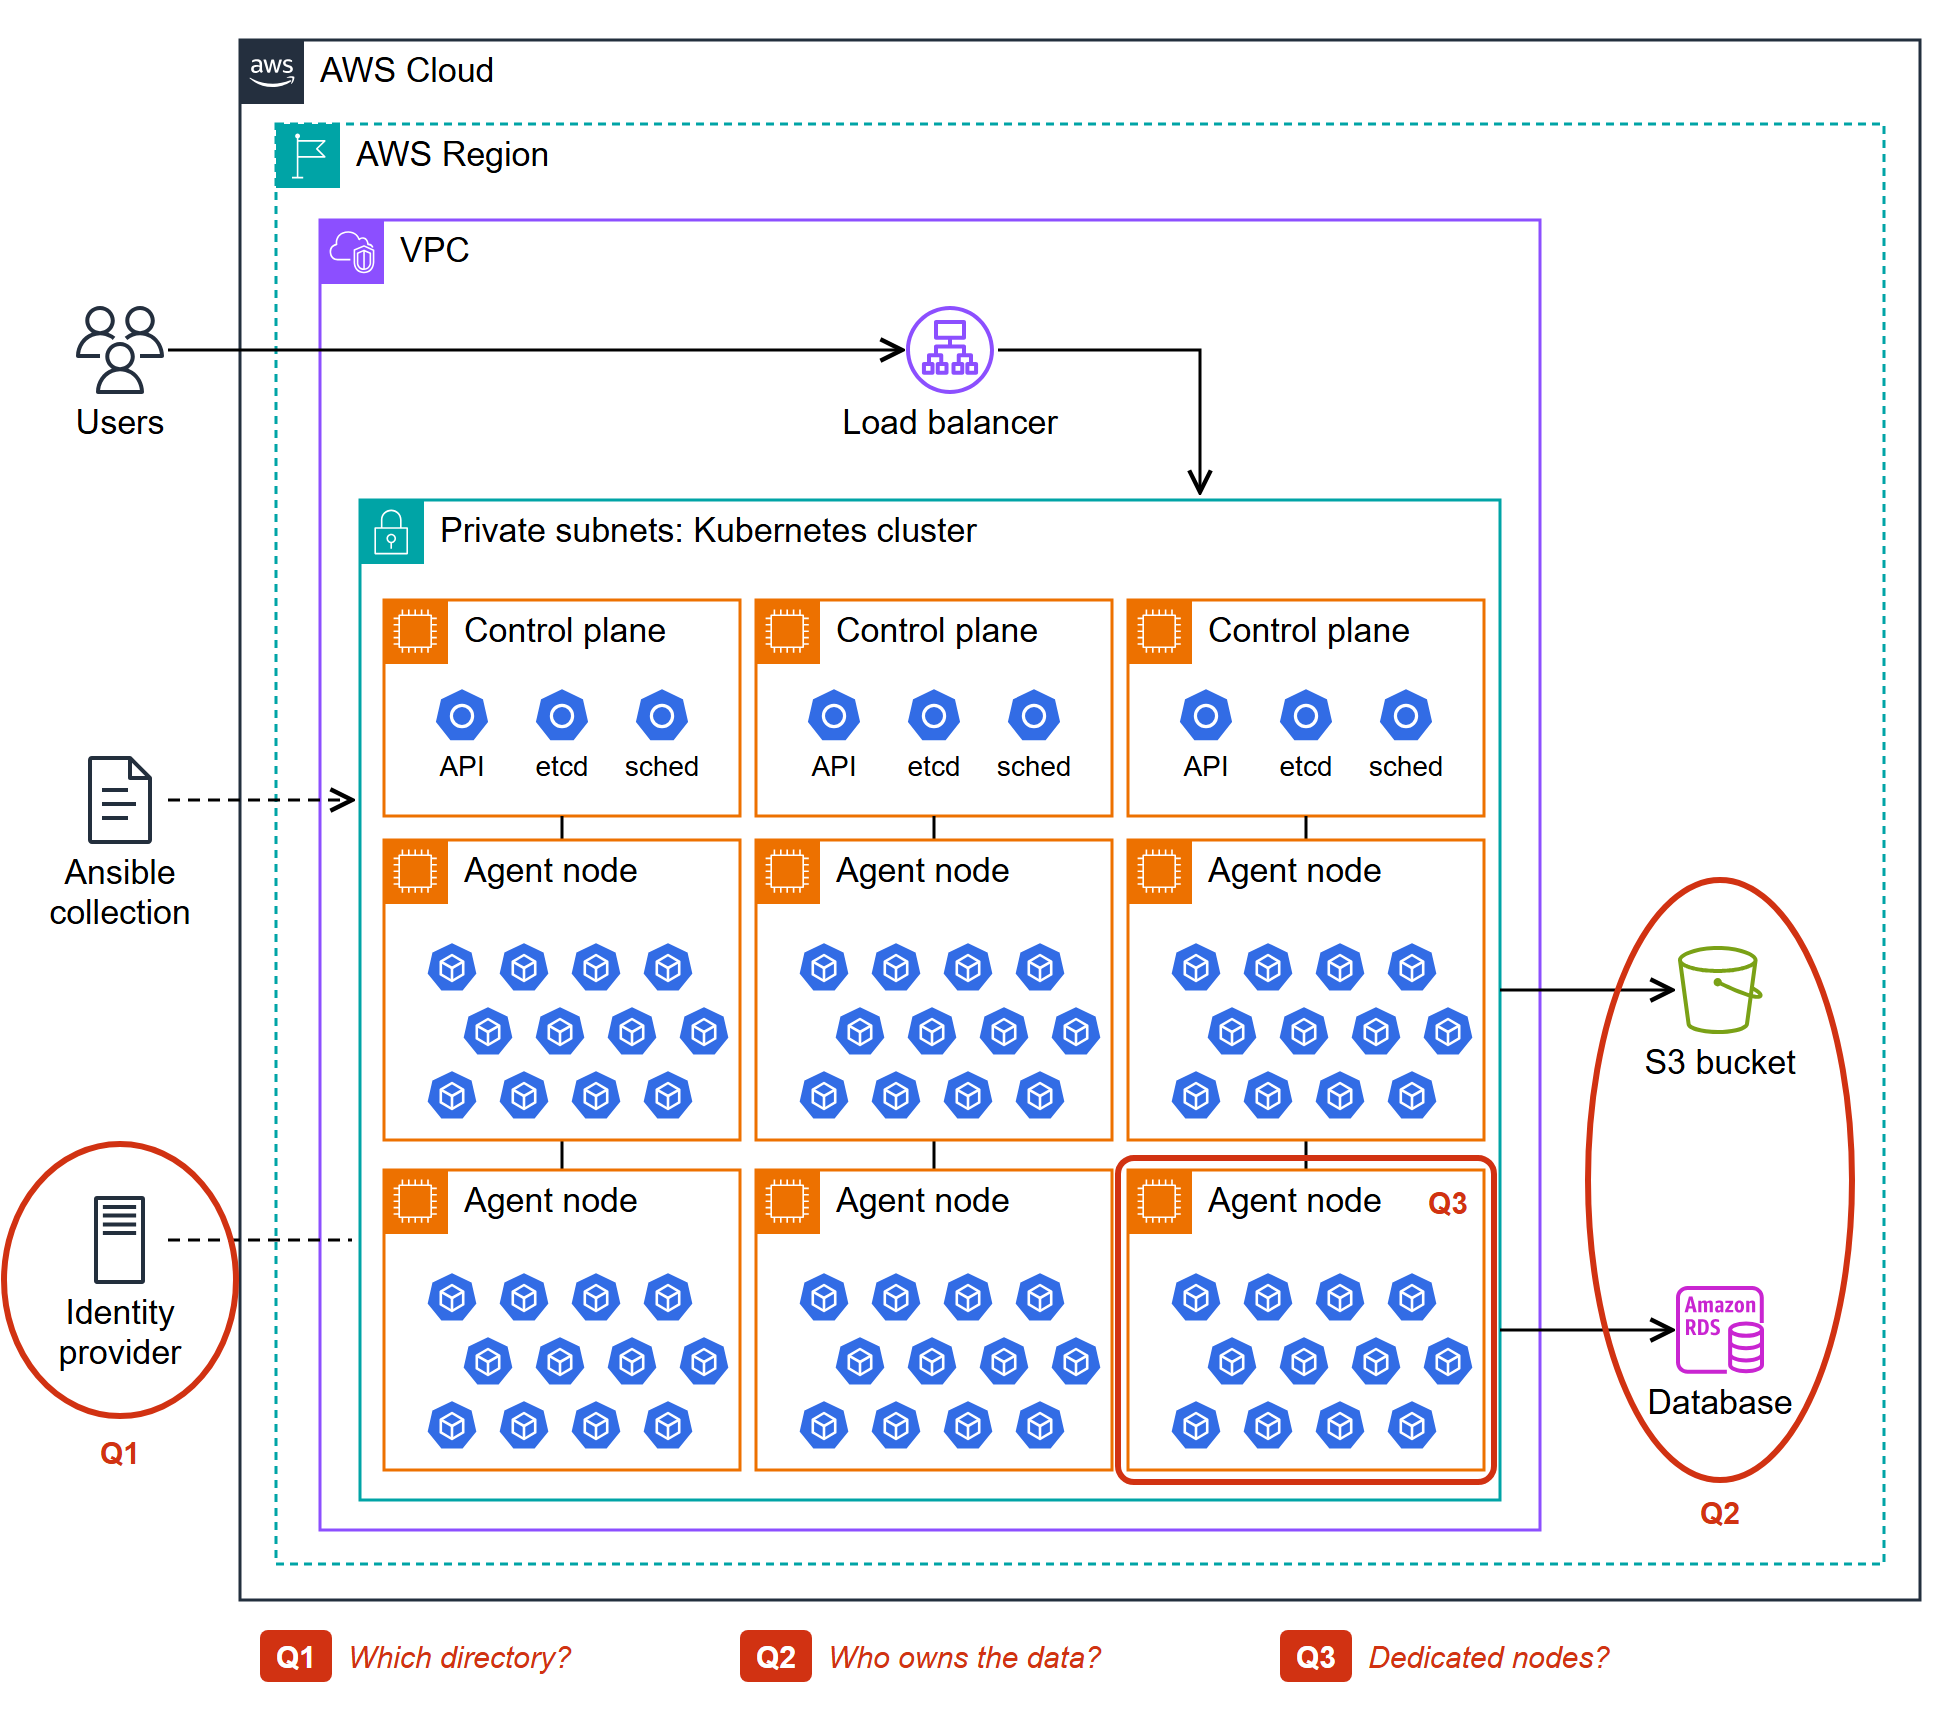
A pod-placement diagram. Which workloads run on which kinds of nodes, what each one needs to start, and what it talks to. This showed requirements that nobody had said out loud. A workload that must run on certain nodes, or a component that quietly depends on another, is a sizing and design input. You want to know about it before the build, not during.
An identity-flow diagram. The path a user takes from login to the application, and the path a service takes when it calls another service. Identity is where vague answers do the most damage, because every security review asks about it. Drawing the flow showed each hand-off where trust passes from one system to another. Every hand-off is a question someone has to answer.
Circle the unknowns in red
Click the diagram to see it full size.
A Kubernetes cluster on AWS with control plane and worker nodes full of pods. Red marks show three open questions: which directory, who owns the data, and whether workloads need dedicated nodes.
The most useful thing on both diagrams was not the boxes. It was the red circles.
I used three styles:
- Solid: confirmed, either in the code or by the customer.
- Dashed: assumed. I think it works this way, but nobody has confirmed it.
- Red circle with a number: unknown. Someone has to decide or confirm it before we can design that part.
Each number matched a line in a list of open questions, so a red circle was never just a worry. It was a specific question with a place on the page.
This changed the conversation. "We need more information" is easy to agree with and easy to ignore. "Here are the things we need you to confirm, and here is where each one sits in your system" is concrete. The customer could see their own system, see exactly what was missing, and see why it mattered. They agreed to answer the list.
Different audiences, different views
The same findings went to different people in different forms.
Engineers got the detailed diagrams. They needed node types, flows and hand-offs.
Leadership got a story deck. A few slides that follow one path from start to finish: where we are, where we're going, and what's blocking the way. The red circles stayed in, because a short list of decisions is something leadership can act on. Leaders don't need every box. They need to know which decisions are theirs.
Keeping one source of truth and changing only the level of detail meant everyone was looking at the same facts.
Results
- Vague answers became a written question list that the customer agreed to answer.
- The design decisions could be made, because each one rested on a confirmed answer instead of a guess.
- Hidden requirements came out early, during discovery instead of during the build.
- The diagrams became a shared reference for the customer, the engineers and leadership.
Retrospective
Read the source. When the answers are vague, the code usually isn't. Reading it was slower than a meeting but faster than a redesign.
Draw to find out what you don't know. A diagram you can't finish is useful. The gaps are the point.
Make unknowns visible and specific. A red circle with a number turns "we need more information" into a request someone can answer.
Match the detail to the audience. Same facts, different depth. Engineers need the flows. Leadership needs the decisions.
What I'd do differently: bring the first rough diagram to the very first follow-up call, even half-finished. The red circles start the right conversation sooner.
How do you run discovery when the answers are vague? Tell me in the comments.
This is the last post in the Building in Government Cloud series. Thanks for reading.


