Excessive database error and audit logging can quietly become a performance bottleneck in Amazon Aurora or Amazon Relational Database Service (Amazon RDS) for PostgreSQL. When you troubleshoot a slow query or a database that can’t keep up under load, you might look at execution plans, indexes, autovacuum, connection pooling, or instance sizing, not at the database’s own error and audit logs. Logging rarely gets a look, but it is real work: the database formats and writes every log line, and, when you export logs, sends a copy to a second destination such as Amazon CloudWatch Logs. If your logging configuration is verbose enough, and your workload runs enough statements per transaction, that work can consume a meaningful share of your database’s capacity without ever showing up as a slow query.
In this post, we walk you through a small, reproducible example on Amazon Aurora PostgreSQL-Compatible Edition that shows exactly when logging overhead matters and when it does not. The short version: at low concurrency, verbose logging costs you almost nothing. At high concurrency, verbose statement logging alone cost about 10 percent of throughput. Adding statement-level audit logging with pgaudit.log = ALL cut throughput by about three times, from 16,202 to 5,039 transactions per second (TPS) on whole-run averages. The exact numbers are in the following section on high-concurrency results. The database is not confused or misbehaving in either case. It is doing exactly what you told it to do, and at scale, what you told it to do is expensive.
Prerequisites
To follow along with this post, complete the following prerequisites:
- Create an Aurora PostgreSQL cluster if you do not already have one. For instructions, refer to Create an Amazon Aurora PostgreSQL-Compatible DB cluster. Any recent instance class works for reproducing the low-concurrency numbers in this post. The high-concurrency numbers were captured on a db.r6i.4xlarge.
- Create an Amazon Elastic Compute Cloud (Amazon EC2) instance in the same virtual private cloud (VPC) to run psql and pgbench against the cluster. For instructions, refer to Create your EC2 resources and launch your EC2 instance, or use the quick-connect option to set up connectivity between your Amazon RDS database and EC2 compute instance.
- Install the PostgreSQL client tools on that EC2 instance. On Amazon Linux 2023, pgbench ships alongside psql in the same package:
The setup
We used a db.r6i.4xlarge Aurora PostgreSQL 17 cluster and a small generic schema, purpose-built for this post. It has three small tables to write to, a lookup table to read from, and one function, demo.fn_process_request. That function does what a lot of real API-backing functions do: look up a few configuration values, call a small nested validation function, build a JSON response, and write three audit rows. In total it runs around 15 SQL statements per call once you count the nested lookups and the nested function call, which is a modest number compared to many production PL/pgSQL functions, but enough to demonstrate the effect clearly.
Following is the sample schema. Run this against the Aurora cluster from the EC2 instance you set up in the prerequisites.
With the tables and the helper function in place, create the main function:
We drive load with pgbench, calling this function with a small varying JSON payload on each call. Save this as lab_pgbench.sql on the EC2 instance:
We test three logging configurations against this same function and the same hardware, changing nothing else:
- Minimal logging.
log_statement = none,log_min_duration_statement = -1, default error verbosity. Most application teams run something close to this as their standard configuration. - Verbose statement logging.
log_statement = all,log_min_duration_statement = 0,log_error_verbosity = verbose. This logs every statement, including its duration, and adds a detailed source-location line after every log entry. It is a common configuration when a team wants full visibility into what the database is doing, often turned on temporarily while investigating an issue and then never turned back off. - Verbose logging plus pgaudit. The same settings as in the previous run, with
pgaudit.log = 'ALL'added on top.pgauditis a widely used extension for compliance-driven audit logging. Setting its log class toALLcaptures every statement class. That includes statements executed inside a function body as well as the top-level call from the client.
All parameter changes here go through the Amazon RDS or Aurora parameter group. log_statement, log_min_duration_statement, log_error_verbosity, and pgaudit.log are all dynamic parameters, so changes to them apply immediately without a reboot. pgaudit itself has to be added to shared_preload_libraries before you can use it at all, and that parameter is static, so adding the extension for the first time does require one reboot. Once it is loaded, turning its logging on and off afterward is instant.
To switch from minimal logging to verbose statement logging, run:
Reboot the instance to add pgaudit for the first time, because shared_preload_libraries is static:
After the reboot, turning pgaudit logging on is a single dynamic parameter, applied immediately:
Between every test run, we confirmed the settings had actually taken effect on a live connection before trusting the result:
At low concurrency, the cost is invisible
We ran 8 concurrent pgbench clients against each configuration for 20 seconds, using the same command each time and changing only the server-side logging settings in between:
Minimal logging:
Verbose statement logging (log_statement = all, log_min_duration_statement = 0, log_error_verbosity = verbose):
Verbose logging plus pgaudit.log = ‘ALL’:
Lined up side by side:
| Configuration | Average latency | Throughput |
| Minimal logging | 3.07 ms | 2,603 TPS |
| Verbose statement logging | 3.06 ms | 2,612 TPS |
| Verbose logging + pgaudit.log = ALL | 3.14 ms | 2,549 TPS |
There is no meaningful difference here. All three numbers are within normal run-to-run variance. If you tested your logging configuration this way, at a handful of connections, in a development environment, you would reasonably conclude that verbose logging and full audit logging cost nothing and are safe to leave on everywhere.
That conclusion would be wrong, and the reason it looks right at this scale is straightforward. At 8 concurrent clients, each backend can write its log lines without much contention. There is plenty of spare CPU. The logging collector, the process that collects log output from every backend and writes it to disk, is nowhere near its own capacity. The extra work is real, but it is small and it is parallel.
At high concurrency, pgaudit cuts throughput by about three times
We reran the same three configurations at 800 concurrent clients for 40 seconds, changing nothing about the function or the query. We added -P 5 --progress-timestamp so we could see throughput and latency evolve over the run, rather than only the final average:
Minimal logging:
Throughput ramps up in the first interval as clients connect, then holds a flat line around 16,000–16,700 TPS with a low standard deviation, meaning individual transaction latency is consistent, not only the average.
Verbose statement logging:
Here you can see the oscillation directly in the progress lines: throughput drifts down from around 15,600 TPS to around 14,000 TPS and back up again on a roughly 10-second cycle, with standard deviation rising each time it dips. It never collapses the way the next configuration does, but it is clearly not as flat as the minimal logging run.
Verbose logging plus pgaudit.log = ‘ALL’:
This is a different shape entirely, not an oscillation around a lower average but a drop to a new, much lower plateau, 3,600–3,700 TPS, where it sits for most of the run. Latency at that plateau is pinned around 218 milliseconds, roughly four and a half times the minimal logging average, and it stays there for interval after interval rather than recovering. The one brief jump back up to 6,900 TPS partway through is the exception, not the rule, for this run.
Summarized:
| Configuration | Average latency | Throughput |
| Minimal logging | 49.06 ms | 16,202 TPS |
| Verbose statement logging | 54.44 ms | 14,654 TPS |
| Verbose logging + pgaudit.log = ALL | 158.11 ms | 5,039 TPS |
The following graphs show Amazon CloudWatch Database Insights DB load by wait event at 800 clients.
The first graph shows the wait events under minimal logging.
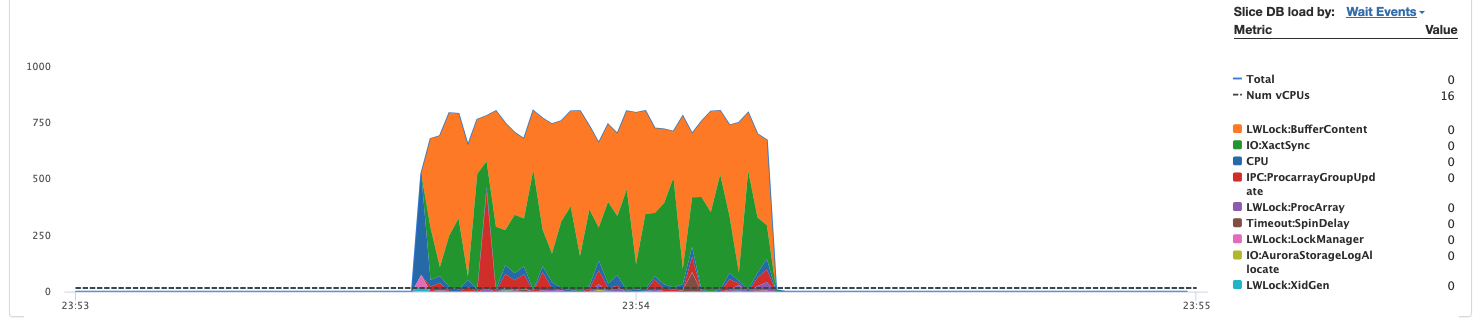
Figure 1: Load is dominated by LWLock:BufferContent and IO:XactSync, the expected wait events for a write-heavy workload
The second graph shows the same workload with pgaudit.log = ALL.
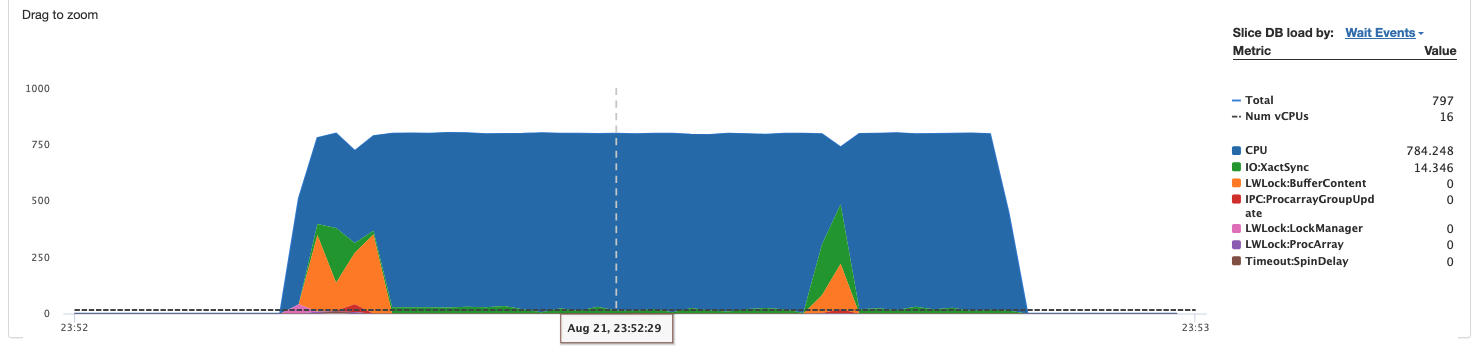
Figure 2: Load is pinned near 800 sessions, almost entirely in the CPU bucket (784 of 797 average active sessions), with the LWLock and IO wait events that dominated the healthy run reduced to brief transients
What the sessions are actually doing during the slow window
Amazon CloudWatch Database Insights graphs are the fastest way to see this happening, but you do not need CloudWatch Database Insights to detect it. pg_stat_activity shows you the same thing directly, and it is worth sampling it yourself so you understand what a screenshot like the ones shown earlier is actually showing.
We sampled pg_stat_activity once a second during both the minimal logging run and the pgaudit.log = ALL run, at the same 800-client concurrency, using a shell loop running for the duration of the pgbench run alongside it:
Then we counted how often each wait event appeared across all the samples:
Under minimal logging, the wait event distribution across roughly 28,000 samples looked like this:
-:- is what our query prints when both wait_event_type and wait_event are NULL, which is how PostgreSQL represents a session that is actively running on CPU rather than waiting on anything. Reading the table as percentages:
| Wait event | Share of samples |
IO:XactSync | 47% |
LWLock:BufferContent | 47% |
| No wait event (CPU) | 1 to 3% |
| Everything else | under 3% combined |
That is a completely ordinary picture for a write-heavy workload under load. Sessions are waiting on the transaction commit sync and on buffer content locks while they insert rows, which is exactly what you would expect.
Under pgaudit.log = ALL, at the same concurrency, the same query, the same hardware, the same sampling loop:
As percentages:
| Wait event | Share of samples |
| No wait event (CPU) | 94 to 100% per second, averaging around 97% |
IO:XactSync | 4.4% |
LWLock:BufferContent | 1.1% |
| Everything else | under 1% combined |
The picture inverts almost completely. The wait events that dominated the healthy run nearly disappear. Nearly every active session shows no wait event at all, meaning PostgreSQL isn’t reporting them as blocked on any of the resources it instruments: locks, buffers, I/O, or client communication. That is consistent with the bottleneck sitting in the log-writing path itself, a part of the system that is not covered by PostgreSQL’s wait event instrumentation, rather than in query execution, locking, or storage.
The two CloudWatch Database Insights graphs shown earlier show exactly this. In the minimal logging run, database load stays low and is made up almost entirely of the orange LWLock:BufferContent and green IO:XactSync bands. In the pgaudit.log = ALL run, load jumps to nearly 800 average active sessions and stays there, and that whole area is blue, the CPU bucket, with barely a sliver of the wait events that were dominant a moment ago.
The log files themselves confirm it
Amazon RDS and Aurora rotate the PostgreSQL error log at a fixed size, 400,000 KB by default, and you can list the log files for an instance directly:
Under normal conditions, each log file rotates once and lands right around that size limit. During both of our high-concurrency runs, we saw an extra file appear with a _0 suffix, which is what happens when the log fills its size limit again before the next scheduled rotation. During the verbose logging run, that second file was around 250–280 megabytes. During the pgaudit.log = ALL run at the same concurrency, it was 537 megabytes, more than five times the instance’s normal rotation size, written in well under a minute.
That is the mechanism in one number. pgaudit set to ALL does not log only the statement your client sent. It logs a separate audit entry for every nested statement executed inside a function body too, including the full statement text for each one. Catching activity that happens inside a function call, not only the top-level request, is the entire point of statement-level audit logging. A function with 15 nested statements does not produce one log entry per call. It can produce closer to 15, each with its own timestamp, backend information, and statement text. At 800 concurrent callers, that adds up to hundreds of megabytes of log output a minute. In our pgaudit.log = ALL run, a single 537 MB log file was written in well under a minute.
Why this matters more than it looks like it should
The pattern here is worth naming explicitly, because teams fall into a specific trap. Verbose logging and audit logging are usually enabled deliberately, for genuinely good reasons: debugging an issue, satisfying a compliance requirement, or giving an operations team full visibility into database activity. Nobody enables pgaudit.log = ALL by accident.
The problem is not that the setting is wrong. The problem is that its cost is invisible at the scale most people test at, and only shows up at the scale that matters, which is production, under real concurrent load.
If your team’s process is to validate a change like this with a quick manual test or a small load test with only a few connections, you will see nothing. The numbers in this post confirm that directly: at 8 clients, three very different logging configurations produced results within one percent of each other. You would ship the change with confidence and find out it costs you most of your throughput only once traffic is high enough to matter. That is usually the worst possible time to find out.
What to check and what to do about it
A few practical takeaways, in the order we would check them.
Check your current logging configuration before assuming your bottleneck is somewhere else. SELECT name, setting FROM pg_settings WHERE name LIKE 'log%' OR name LIKE 'pgaudit%' will tell you in one query. If you see log_statement = all combined with pgaudit.log set to anything other than none, the cost of that combination scales with how many nested statements your busiest functions run and how many concurrent sessions call them, not with your data volume.
If you have a genuine audit requirement and cannot turn pgaudit off, know that pgaudit.log_statement = off keeps the structured audit record, who executed what class of statement, against which object, and when, while dropping the embedded SQL text from each entry. The embedded SQL text drives most of the log volume in the pgaudit numbers shown earlier in this post. Dropping it while keeping the who, what, and when should substantially reduce that volume while preserving what an auditor actually needs. Confirm the reduction against your own workload before relying on it. It is worth trying before disabling audit logging outright.
Audit only the statement classes you need. pgaudit.log = 'ALL' includes the READ class, and about 12 of the roughly 15 statements this function runs per call are SELECT statements. Many compliance requirements are met with WRITE, DDL, and ROLE, for example pgaudit.log = 'write, ddl, role'. To narrow it further, use object-level auditing with pgaudit.role, or set pgaudit.log for specific database roles with ALTER ROLE ... SET pgaudit.log.
Test logging configuration changes at production-representative concurrency, not at whatever concurrency is convenient to run on your laptop or in a quick manual check. pgbench with the -c flag set high enough to resemble your real connection count will show you the effect that a handful of manual queries cannot. Add -R if you want to fix the offered rate and observe response time and scheduling lag directly.
If you do see a throughput collapse that correlates with heavy logging, confirm it two ways before you conclude anything. Sample pg_stat_activity for wait events during the slow window, and check aws rds describe-db-log-files for unusually large or unexpectedly frequent log files around the same time. Between the two, you will have both the behavioral signature and the physical evidence.
Clean up
To avoid ongoing charges, delete the resources you created to follow along with this post. Delete the Aurora PostgreSQL-Compatible Edition instance and cluster:
If you created a custom cluster parameter group for the pgaudit and logging settings used in this walkthrough, delete it after the cluster is gone:
Terminate the EC2 instance you used to run psql and pgbench:
If you added the demo schema to an existing database instead of a new cluster, drop it instead of deleting the whole cluster:
Replace your-instance-id, your-cluster-id, your-parameter-group-name, and i-xxxxxxxxxxxxxxxxx with your actual resource identifiers before publishing.
Conclusion
In this post, we showed how excessive logging can quietly cut your database’s throughput, and how to catch it before it costs you. We tested the same PL/pgSQL function on the same Aurora PostgreSQL instance under three logging configurations. At low concurrency, the differences were within noise. At 800 concurrent clients, verbose statement logging alone reduced throughput by about 10 percent. Adding pgaudit.log = ALL cut throughput by about three times and raised average latency from about 49 milliseconds to 158 milliseconds, with wait event sampling confirming the bottleneck sat in the log-writing path rather than in query execution or locking.
This doesn’t mean verbose or audit logging are mistakes. Both exist for real reasons. It means their cost is concurrency-dependent, and a configuration validated in development can behave very differently under production traffic. If your database falls short of expected throughput under load, rule logging in or out early using the same concurrency-matched testing and direct evidence shown here, before spending time on query tuning or instance sizing that may not be where the problem lives.
For more information on diagnosing database load, see CloudWatch Database Insights in the Amazon CloudWatch User Guide.


