For services handling high-stakes operations such as financial transactions, order processing, or eligibility decisions, regression testing has to catch behavior changes before production deployment. Traditional integration tests help, but they can suffer from unreliable dependencies that cause false positives and slow down deployment pipelines. In this post, I walk through how I built an automated regression testing framework for my team using AWS services. Each run of the framework is a simulation: it replays a sample of production traffic against the new code and compares the results to validate that changes do not break existing functionality.
To build this framework, you need a service whose requests and responses you can capture to a stream such as Amazon DynamoDB Streams, a pre-production environment that can receive replayed requests, and a deployment pipeline with a gate that can read an Amazon CloudWatch alarm.
Minimally invasive design
The framework’s power lies in its modular design. Components fit between existing blocks in your system with minimal changes to your core business logic. Stateless systems need no changes. Stateful systems add a check that recognizes replayed requests and skips side effects. The same components capture, replay, and validate traffic at the API gateway, between microservices, or at internal service boundaries.
Focus: Regression detection
This framework specifically targets no-impact validation, confirming that code changes do not break existing behavior. It does not test new business logic. A/B testing and user acceptance testing handle that. Instead, the framework gives engineering teams confidence that refactors, upgrades, and feature-flagged deployments maintain existing functionality.
Scope and applicability
The framework works best with computation-heavy, stateless systems, where replaying a request produces the same output without side effects. Examples include pricing calculators, validation engines, eligibility decision engines, and data transformation pipelines.
Stateful systems need more coordination. These include transaction processing (payments, orders, inventory) and non-idempotent writes that would create duplicate records or notifications. They also include randomized logic such as A/B assignment, and multi-step workflows such as shopping carts, where each request depends on earlier state. “Handling stateful dependencies” later in this post covers patterns for these systems.
Proven results
In more than 6 months of production use in our system, the framework caught five regressions that would have affected customers, with zero false positives that blocked valid deployments. Teams can set alarms on the share of replayed requests whose results match production (commonly 99.9 percent) to block potentially problematic deployments. This maintains faster deployment velocity through automated quality gates. The framework also standardizes testing approaches across all AWS Regions, which gives consistent validation regardless of deployment location.
Use cases: When and why to simulate for regression detection
The framework addresses three critical scenarios where engineering teams need confidence that code changes do not break existing functionality:
1. Refactoring and technical upgrades
Teams refactoring internal logic or upgrading dependencies need confidence that behavior hasn’t changed. Post-deployment monitoring only catches issues after they affect customers. Simulation provides pre-deployment validation with zero customer impact.
Example: A team upgraded their data processing algorithm’s internal data structures for performance. Unit tests passed, and simulation verified that complex real-world request patterns still produced identical business logic outputs across all Regions.
2. Feature toggle deployments
Code deployed behind feature flags creates a unique challenge: the code is deployed but not yet active. Engineering teams need confidence during the deployment phase, whereas product teams monitor the feature after toggle activation using standard product metrics.
Example: A team added a new validation rule behind a feature flag. Simulation ran against the new code path using production traffic, validating that the deployment itself didn’t introduce regressions before the product team turned on the feature.
3. Validating impact boundaries for significant changes
When product teams predict a change will affect a specific percentage of requests, engineering teams need confidence in that boundary. The change should not affect other request types.
Example: Product predicted a business rule change would affect 15 percent of requests in specific Regions. Simulation confirmed 14.2 percent impact within the predicted request patterns and 0 percent impact on other request types, validating that the change didn’t break functionality outside its intended scope.
Architecture overview: Versatile component-based design
Figure 1 shows the framework. When a deployment reaches the deployment gate, the pipeline publishes an event to Amazon Simple Notification Service (Amazon SNS). Amazon SNS delivers it to an Amazon Simple Queue Service (Amazon SQS) queue. An AWS Lambda function reads the queue and starts the AWS Step Functions workflow. The workflow turns replay on and off. While replay is on, the replay function reads captured requests from the Amazon DynamoDB stream and sends them to the new code. It logs a match result for each request to Amazon CloudWatch Logs. A CloudWatch alarm on the match fraction tells the deployment gate whether to promote the deployment.
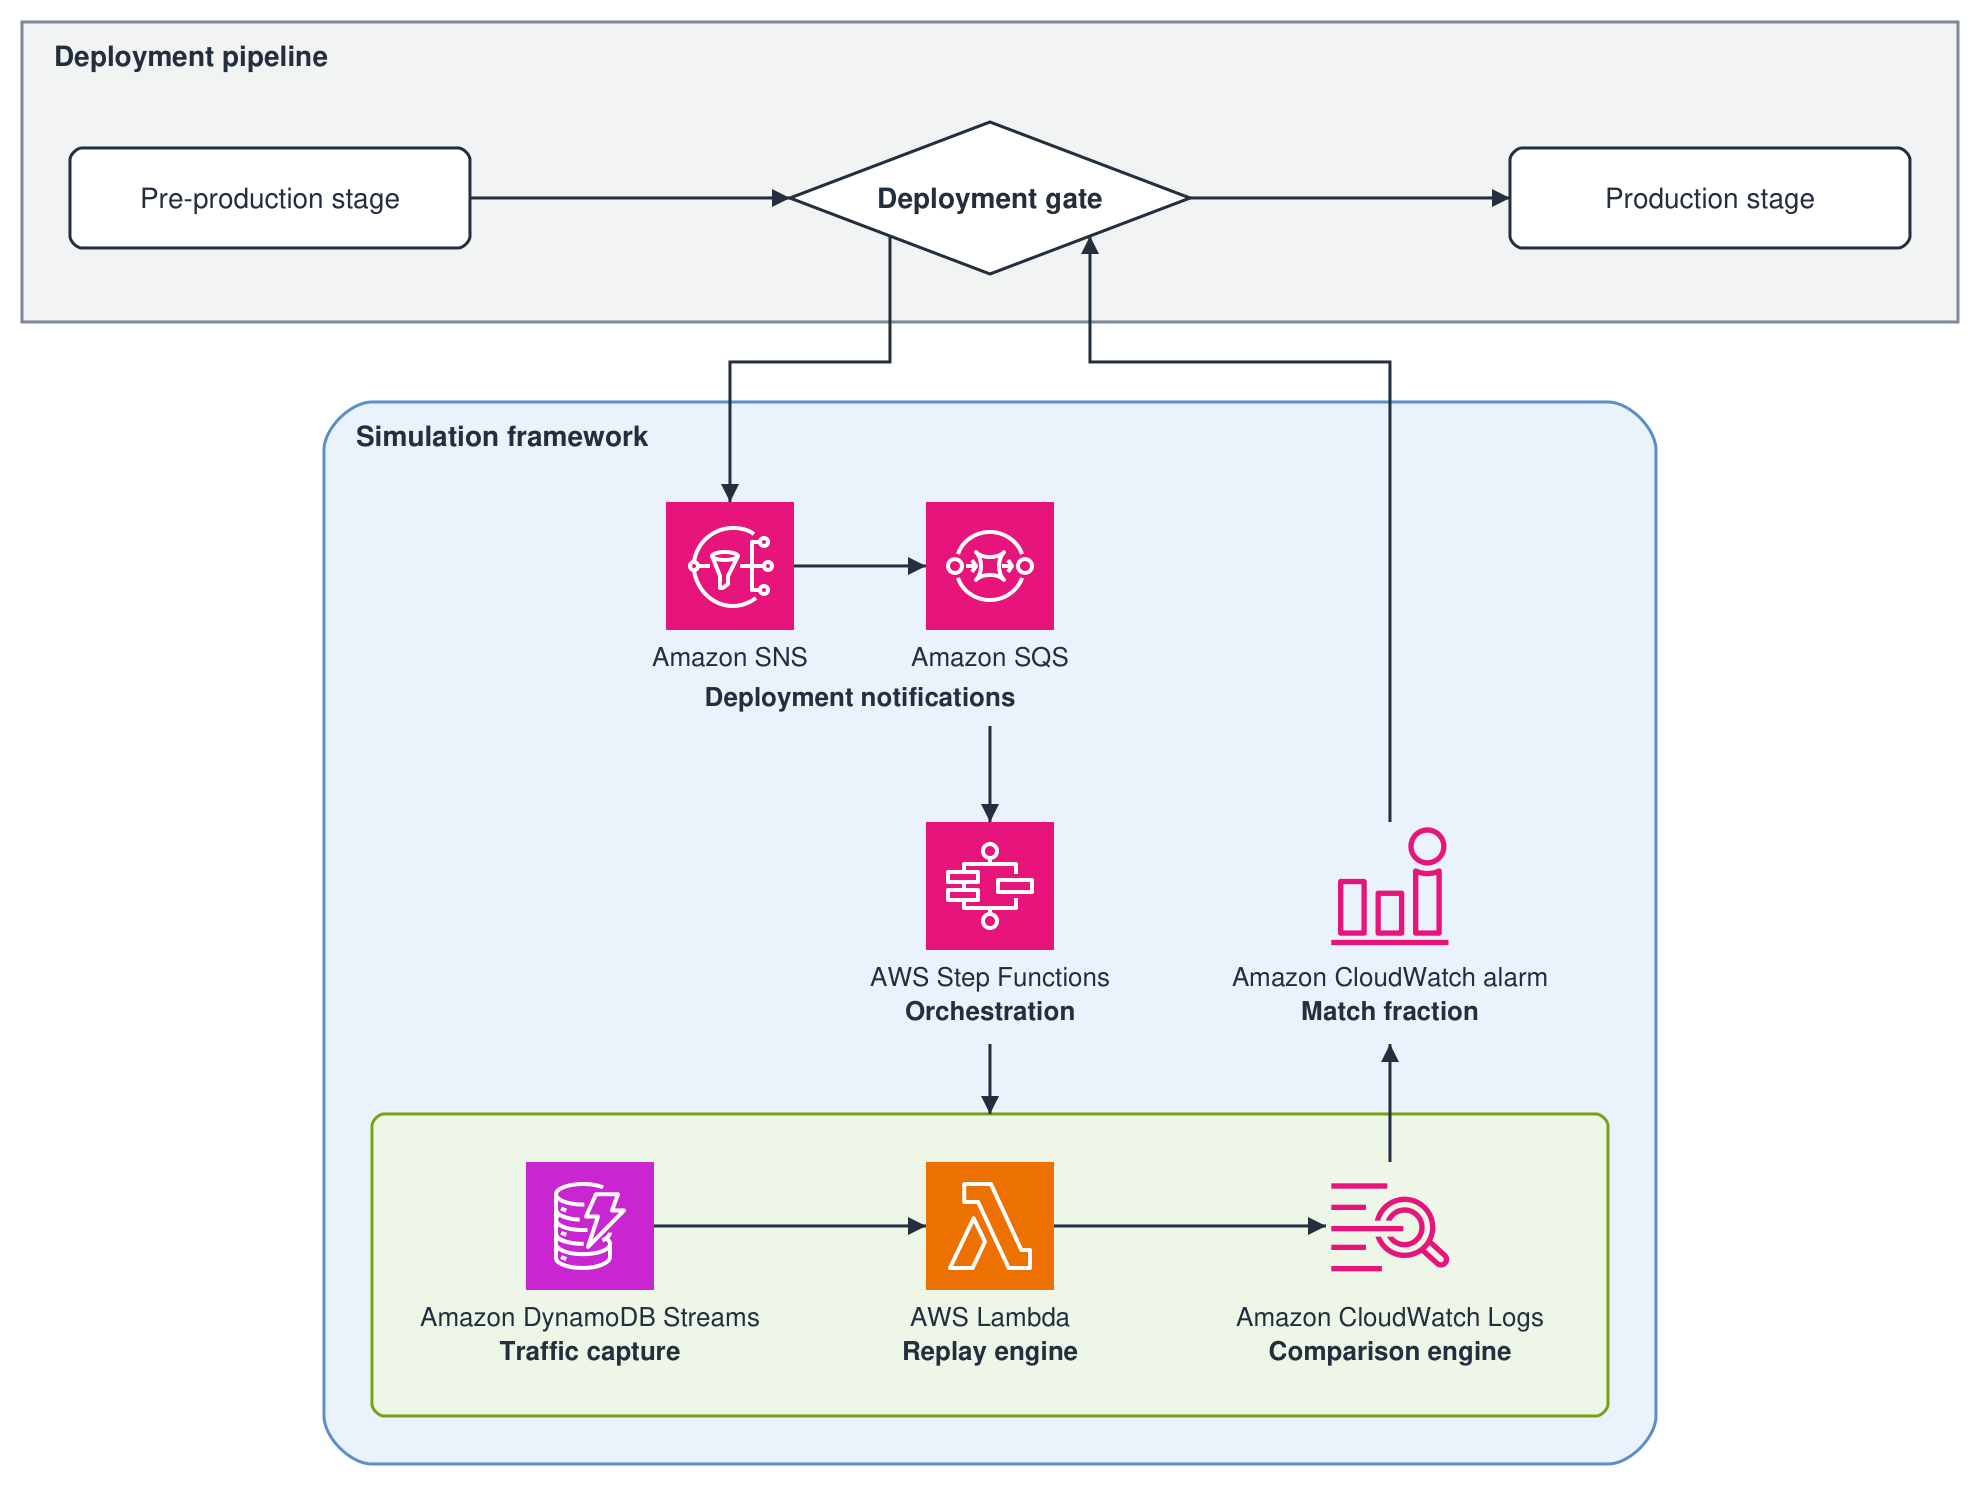
Figure 1: Regression testing framework architecture
Component insertion flexibility
The framework is designed to be versatile. Each component can be positioned to capture inputs and outputs at any system boundary:
- API level: Capture HTTP requests and responses at gateway or service endpoints.
- Service level: Capture inter-service communication and message passing.
- Database level: Capture query inputs and results for data layer validation.
- Message queue level: Capture message processing for event-driven architectures.
You can compare end-to-end outputs or scope the comparison to one block of business logic. Anything after that block, such as formatting or downstream API calls, falls outside the comparison.
Tech stack and rationale
I chose managed AWS services to keep operational overhead low and to pay only for the resources each simulation consumes:
- AWS Step Functions: Visual workflow orchestration with built-in error handling and state management for coordinating timed operations.
- AWS Lambda: Serverless execution with automatic scaling. Pay only for actual simulation time.
- Amazon DynamoDB: Low-latency access to production request data with global tables for multi-Region support. (Note: We used DynamoDB as part of our existing tech stack. You can adapt the framework to the storage system you currently use.)
- Amazon CloudWatch: Unified logging, metrics, and alarming. Amazon CloudWatch Logs Insights supports complex queries without additional infrastructure.
- Amazon SNS and Amazon SQS: Reliable publish/subscribe messaging for pipeline integration with retry logic and dead-letter queues.
Component 1: Traffic capture – universal storage with complete parameter logging
Core function: Captures actual production request documents and their associated responses, not synthetic data or mocks. This complete production dataset is what makes regression detection accurate by replaying the same requests that flowed through the production system with all their complexity and edge cases.
Key challenge: Capturing all parameters and context needed to reproduce the component’s behavior accurately. Missing any input parameter, request context, or metadata can lead to inaccurate replay and false regression signals.
Apply domain-specific knowledge to identify and capture all inputs your system needs for accurate replay. This includes obvious parameters (request body, headers) and less obvious context (user session state, feature flags, regional settings, timestamps). The completeness of your capture directly determines replay accuracy.
Storage flexibility: The framework design works with any storage system that can generate events:
- Amazon DynamoDB Streams: For document-based systems.
- Amazon Relational Database Service (Amazon RDS) and Amazon Aurora: Using database triggers or change data capture.
- Amazon Kinesis Data Streams: For high-throughput event streaming.
- CloudWatch Logs: For API gateway or application-level capture.
- Amazon Managed Streaming for Apache Kafka (Amazon MSK): For Kafka-based architectures.
Component 2: Replay engine – running simulated production traffic against test environments
Core function: Takes batched production requests from storage streams and invokes test environment APIs with the same parameters, capturing responses for comparison.
Key challenge: The system needs to distinguish replayed traffic from production traffic. Without this distinction, replayed requests would be processed identically to production requests, leading to duplicate processing and unintended side effects.
The replay engine solves this by attaching simulation IDs to every replayed request:
Component 3: Comparison engine – domain-specific output analysis
Core function: Compares specific business logic outputs between production and simulation responses to calculate match fractions. The engine extracts the outputs you’ve chosen to focus on and determines whether they match within acceptable thresholds.
Key challenge: Determining what to compare for your specific application. This requires deep domain knowledge. You need to identify which outputs represent your core business logic as opposed to downstream formatting, third-party variations, or environmental differences that do not indicate actual regressions.
Before logging, reduce each response to the fields that carry your business logic, and normalize them so equivalent outputs compare equal, for example by dropping timestamps and sorting lists. The replay engine compares the reduced results and logs one JSON line for each request. Each line has a numeric match field that is 1 when the results are equal and 0 when they differ or the replay fails. Both results stay in the line for investigating mismatches:
CloudWatch Logs Insights discovers fields in JSON log events, and the query averages match for one simulation:
When the replay completes, run the query and publish the match fraction as a custom CloudWatch metric for the deployment gate’s alarm. The implementation reference at the end of this post shows a Lambda function that does this. What constitutes a meaningful comparison depends on your system architecture and business requirements. For the full query language, see the CloudWatch Logs Insights query syntax.
Component 4: Orchestration – CI/CD pipeline integration
Core function: Manages the timing and coordination of simulation components: starts traffic capture, waits for sufficient data collection, stops capture, evaluates results, and provides pass or fail decisions for deployment gates.
Key challenge: Integrating simulation results into continuous integration and continuous delivery (CI/CD) pipelines as reliable quality gates. Deployments need automated pass or fail decisions based on simulation outcomes, not only monitoring data that requires manual interpretation.
Deployment events reach the AWS Step Functions workflow through Amazon SNS, Amazon SQS, and a Lambda function that starts the execution, with retries and error handling.
Replay starts and stops by enabling and disabling the event source mapping between the capture stream and the replay function. Lambda can take several minutes to stop or restart polling after the mapping changes. The workflow waits a few minutes after stopping replay before it evaluates results. When replay is enabled again, the mapping can resume with records captured while it was off. Set a maximum record age on the mapping to skip stale records, and use reserved concurrency on the replay function to cap the burst.
A CloudWatch alarm on the match fraction blocks the deployment when it falls below your threshold. In AWS CodePipeline, for example, an entry condition with a CloudWatchAlarm rule on the production stage blocks promotion while the alarm is in the ALARM state. Otherwise, the pipeline promotes the deployment. The implementation reference at the end of this post shows the state machine definition and the start and stop functions.
Simulation traffic controls and production safety
Critical safeguards prevent overwhelming test environments and maintain production safety:
Typical configuration: 5 percent traffic replay with 200-record batching provides sufficient coverage while maintaining system stability.
Handling stateful dependencies
As noted in “Scope and applicability,” systems with stateful components can use this framework with additional patterns.
1. Idempotency controls
Services in the simulated logic path can use the simulation IDs described in Component 2 to detect replayed requests. They then skip stateful operations (database writes, notifications, external API calls) while still returning a response.
For services that need further isolation, simulation IDs can also be used to route simulation traffic to separate test instances or maintain separate simulation state.
2. Deterministic randomization
For systems using randomization (A/B assignment, sampling, shuffling), use the simulation ID as a seed:
This makes simulation responses reproducible and comparable.
When to reconsider
If adding idempotency infrastructure creates an ongoing maintenance burden that exceeds the value of automated regression testing, consider whether this framework is the right fit. Manual testing or alternative validation approaches might be more practical for your system.
Cost and operational efficiency
The framework’s own Lambda functions, logging, streaming, and orchestration cost little. The primary cost driver is your own system processing replayed requests, which varies based on your architecture. The following is a breakdown of the framework costs only. Prices shown are for the US East (N. Virginia) AWS Region as of October 2026. To estimate your own costs, use the AWS Pricing Calculator.
Cost components:
- Lambda executions: $0.0000166667 per GB-second plus $0.0000002 per request.
- CloudWatch Logs: $0.50 per GB ingested plus $0.03 per GB stored (monthly).
- CloudWatch Logs Insights: $0.005 per GB scanned per query.
- Step Functions: $0.025 per 1,000 state transitions.
- DynamoDB Streams: no read charge when standard AWS Lambda functions read the stream (Lambda Managed Instances incur Streams charges).
- Amazon SNS and Amazon SQS: $0.40–$0.50 per million requests.
Example calculation (24-hour simulation, 5 percent of 100,000 daily requests):
- 5,000 replayed requests × 1 second average duration × 256 MB = about $0.02 Lambda cost.
- 5,000 log entries × 5 KB average = 25 MB logs = about $0.013 ingestion plus about $0.001 storage.
- DynamoDB Streams reads: $0 (included in the preceding Lambda cost).
- One evaluation query scanning 25 MB = about $0.0001 Logs Insights.
- Step Functions and messaging costs = about $0.01.
Total estimated cost: about $0.05 for this example scenario.
Multi-Region deployment multiplies costs by the number of Regions. Higher traffic volumes scale proportionally. For example, 500,000 daily requests (25,000 replayed) cost approximately $0.25 per simulation.
Scale the calculation based on your traffic volume and simulation frequency. Most importantly, the confidence to deploy faster and the hours saved on manual validation far exceed the simulation costs.
Getting started: Phased implementation approach
Build the framework in three phases. Each phase is usable before the next one starts.
Phase 1 – Core components: Set up traffic capture with your chosen event source, create a replay engine with simulation IDs, implement centralized output analysis with structured logging, and build orchestration with Step Functions.
Phase 2 – Automated verification: Design a match fraction calculation with business logic for filtering variances, create CloudWatch Logs Insights queries, and set up CloudWatch alarms for quality gates.
Phase 3 – Full automation: Integrate with deployment pipelines, deploy across multiple Regions, build monitoring dashboards, and tune thresholds based on real data.
Implementation reference
The following sample code is generalized from my team’s production implementation and is not intended for production use as written. Replace the placeholder names and Amazon Resource Names (ARNs) with your own.
Replay function
The AWS Systems Manager Parameter Store parameter named in SIMULATION_PARAMETER holds:
CapturedCall, SimulationProps, TestServiceClient, and reduce stand in for your own request model, simulation settings, service client, and response reduction. reduce returns the normalized business-logic fields as a string.
State machine definition
Start and stop functions
Evaluation function
Conclusion
This component-based simulation framework transformed our deployment process from manual and time-intensive to automated and reliable, saving hours per deployment while achieving high accuracy in regression detection. The modular design means the same building blocks can be inserted anywhere in your system architecture to validate that code changes do not break existing functionality.
Look at how your team catches regressions today. If refactors, dependency upgrades, or feature-flagged releases reach production with only synthetic test coverage, or if regressions surface first in post-deployment alarms, replaying production traffic before deployment closes that gap. Start with one stateless component, such as a pricing or validation engine, where replay needs no changes to your service code.
To get started, see the AWS Step Functions detail page and the AWS Step Functions Developer Guide. This framework also uses AWS Lambda, Amazon DynamoDB, Amazon CloudWatch, Amazon SNS, and Amazon SQS.


